Coolidge, AZ
Quality of Life, Demographics, And Statistics
Living In Coolidge, Arizona Summary
Life in Coolidge research summary. HomeSnacks has been researching the quality of life in Coolidge over the past eight years using Census data, FBI crime data, cost of living data, and other primary sources. Based on the most recently available data, we found the following about life in Coolidge:
The population in Coolidge is 13,347.
The median home value in Coolidge is $127,700.
The median income in Coolidge is $51,512.
The cost of living in Coolidge is 87 which is 0.9x lower than the national average.
The median rent in Coolidge is $892.
The unemployment rate in Coolidge is 14.2%.
The poverty rate in Coolidge is 18.0%.
Table Of Contents
Coolidge SnackAbility
3
Overall SnackAbility
Overall SnackAbility
Jobs
5/10
Housing
6
Affordability
8
Diversity
9.5
Safety
4
Amenities
6
Education
5
Commute
8.5
Coolidge, AZ Crime Report
492
Total Crimes
Total Crimes
3,069.8
Total Crimes / 100k People
Total Crimes / 100k People
32.08%
Above National Average
Above National Average
| Statistic | Count Raw |
Coolidge / 100k People |
Arizona / 100k People |
National / 100k People |
|---|---|---|---|---|
| Total Crimes Per 100K | 492 | 3,069.8 | 2,712.5 | 2,324.2 |
| Violent Crime | 89 | 555.3 | 484.8 | 369.8 |
| Murder | 4 | 25.0 | 6.9 | 6.3 |
| Robbery | 11 | 68.6 | 83.7 | 66.1 |
| Aggravated Assault | 69 | 430.5 | 350.2 | 268.2 |
| Property Crime | 403 | 2,514.5 | 2,227.7 | 1,954.4 |
| Burglary | 44 | 274.5 | 330.0 | 269.8 |
| Larceny | 320 | 1,996.6 | 1,656.0 | 1,401.9 |
| Car Theft | 39 | 243.3 | 241.7 | 282.7 |
Coolidge, AZ Cost Of Living
87
Coolidge's Overall Cost Of Living
Coolidge's Overall Cost Of Living
0.9x
Lower Than The National Average
Lower Than The National Average
| Living Expense | Coolidge | Arizona | National Average | |
|---|---|---|---|---|
| Overall | 87 | 107 | 100 | |
| Services | 97 | 102 | 100 | |
| Groceries | 97 | 101 | 100 | |
| Health | 90 | 94 | 100 | |
| Housing | 56 | 121 | 100 | |
| Transportation | 106 | 105 | 100 | |
| Utilities | 108 | 97 | 100 | |
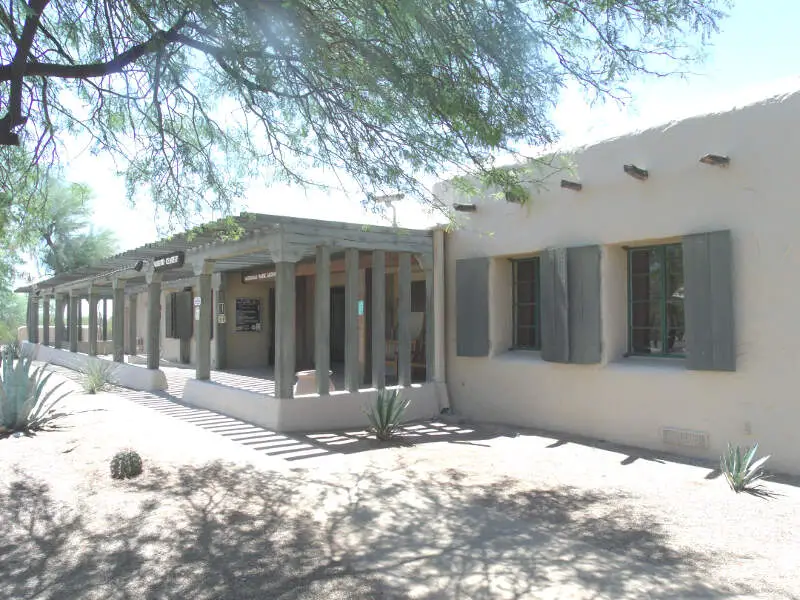
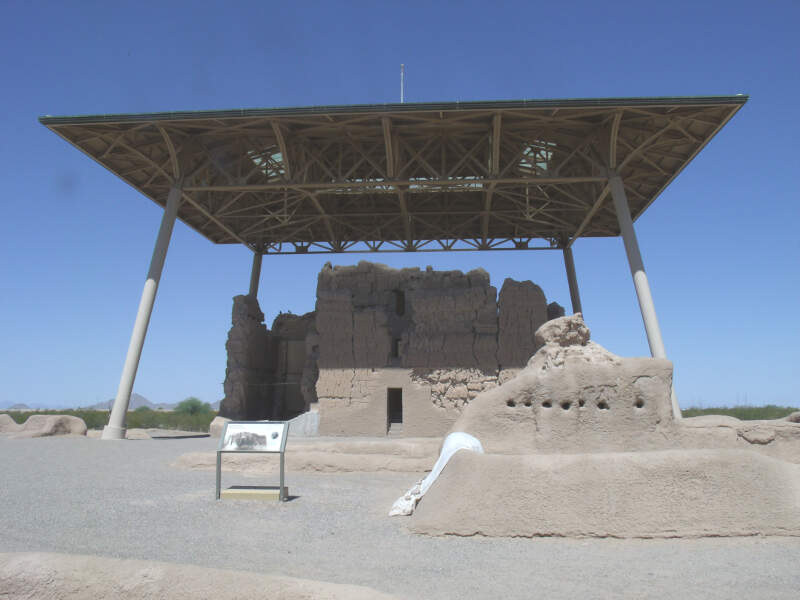
Coolidge, AZ Photos
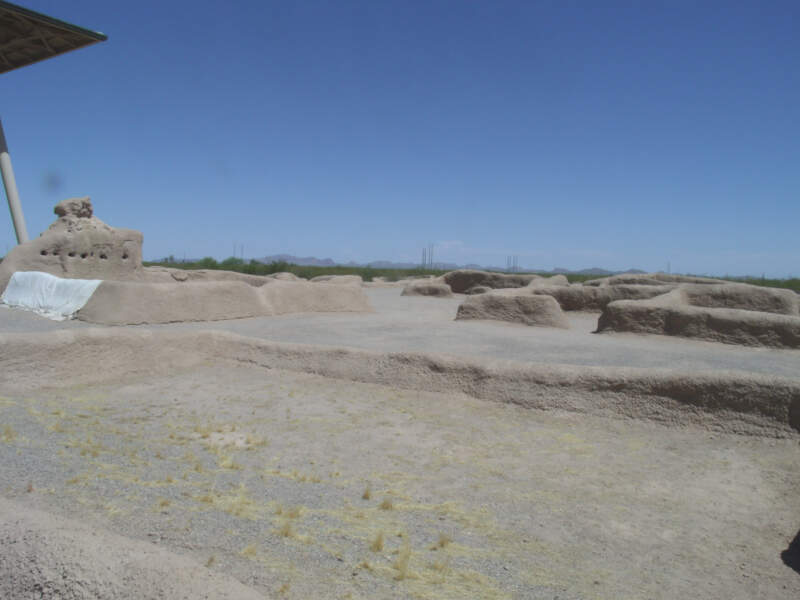
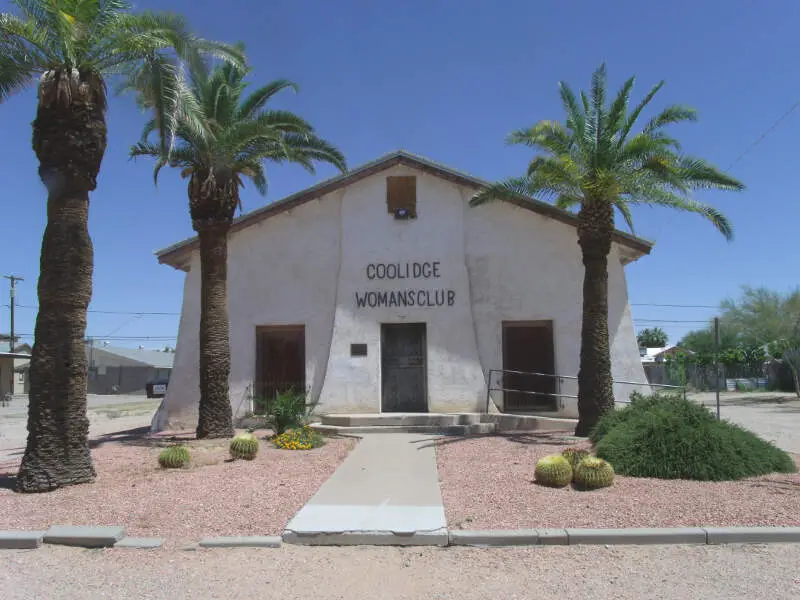
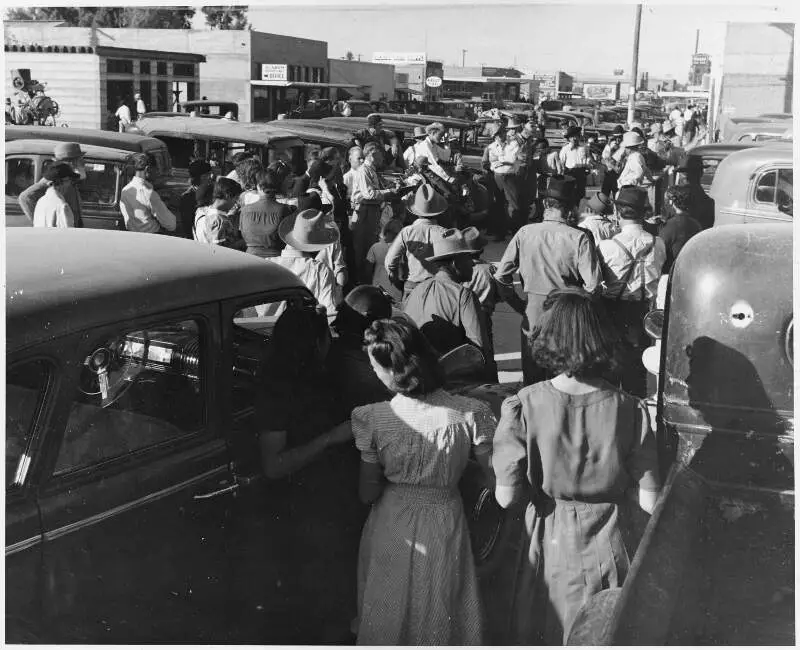
Source: Public Domain


Rankings for Coolidge in Arizona


Map Of Coolidge, AZ
Best Places Around Coolidge
1
Santa Cruz, CA
Population 62,714
2
Gilbert, AZ
Population 262,249
3
Oro Valley, AZ
Population 46,515
4
Fountain Hills, AZ
Population 23,639
5
Chandler, AZ
Population 272,439
6
Sun Lakes, AZ
Population 13,912
7
Marana, AZ
Population 50,834
8
Queen Creek, AZ
Population 57,728
9
Tempe, AZ
Population 178,862
10
Saddlebrooke, AZ
Population 11,252
Population over time in Coolidge
| Year | Population | % Change |
|---|---|---|
| 2021 | 13,016 | 4.1% |
| 2020 | 12,503 | 2.3% |
| 2019 | 12,221 | 1.2% |
| 2018 | 12,073 | 0.8% |
| 2017 | 11,973 | -0.7% |
| 2016 | 12,058 | 2.3% |
| 2015 | 11,785 | 1.5% |
| 2014 | 11,609 | 2.2% |
| 2013 | 11,362 | 5.0% |
| 2012 | 10,817 | - |
Race / Ethnicity in Coolidge
| Race | Coolidge | AZ | USA |
|---|---|---|---|
| White | 32.3% | 53.4% | 59.4% |
| African American | 7.1% | 4.2% | 12.2% |
| American Indian | 5.1% | 3.6% | 0.6% |
| Asian | 0.2% | 3.2% | 5.6% |
| Hawaiian | 0.0% | 0.2% | 0.2% |
| Other | 0.0% | 0.3% | 0.4% |
| Two Or More | 2.7% | 3.2% | 3.2% |
| Hispanic | 52.7% | 31.9% | 18.4% |
Gender in Coolidge
| Gender | Coolidge | AZ | USA |
|---|---|---|---|
| Female | 51.1% | 50.1% | 50.5% |
| Male | 48.9% | 49.9% | 49.5% |
Highest level of educational attainment in Coolidge for adults over 25
| Education | Coolidge | AZ | USA |
|---|---|---|---|
| < 9th Grade | 7.0% | 5.0% | 5.0% |
| 9-12th Grade | 8.0% | 7.0% | 6.0% |
| High School / GED | 36.0% | 23.0% | 26.0% |
| Some College | 29.0% | 25.0% | 20.0% |
| Associate's Degree | 7.0% | 9.0% | 9.0% |
| Bachelor's Degree | 9.0% | 19.0% | 21.0% |
| Master's Degree | 3.0% | 9.0% | 9.0% |
| Professional Degree | 0.0% | 2.0% | 2.0% |
| Doctorate Degree | 1.0% | 1.0% | 2.0% |
Household Income For Coolidge, Arizona
| Income | Coolidge | AZ | USA |
|---|---|---|---|
| Less than $10,000 | 5.6% | 5.5% | 5.5% |
| $10,000 to $14,999 | 3.5% | 3.4% | 3.9% |
| $15,000 to $24,999 | 13.2% | 7.7% | 7.8% |
| $25,000 to $34,999 | 7.0% | 8.5% | 8.2% |
| $35,000 to $49,999 | 19.4% | 12.6% | 11.4% |
| $50,000 to $74,999 | 15.2% | 18.2% | 16.8% |
| $75,000 to $99,999 | 11.0% | 13.5% | 12.8% |
| $100,000 to $149,999 | 17.2% | 16.3% | 16.3% |
| $150,000 to $199,999 | 2.7% | 7.0% | 7.8% |
| $200,000 or more | 5.1% | 7.4% | 9.5% |


