Tucson, AZ
Quality of Life, Demographics, And Statistics
Living In Tucson, Arizona Summary
Life in Tucson research summary. HomeSnacks has been researching the quality of life in Tucson over the past eight years using Census data, FBI crime data, cost of living data, and other primary sources. Based on the most recently available data, we found the following about life in Tucson:
The population in Tucson is 538,167.
The median home value in Tucson is $177,800.
The median income in Tucson is $48,058.
The cost of living in Tucson is 95 which is 0.9x lower than the national average.
The median rent in Tucson is $907.
The unemployment rate in Tucson is 7.0%.
The poverty rate in Tucson is 19.8%.
Table Of Contents
Tucson SnackAbility
4
Overall SnackAbility
Overall SnackAbility
Jobs
5/10
Housing
7
Affordability
5
Diversity
9.5
Safety
3
Amenities
9
Education
7
Commute
8
Tucson, AZ Crime Report
23,774
Total Crimes
Total Crimes
4,319.0
Total Crimes / 100k People
Total Crimes / 100k People
85.83%
Above National Average
Above National Average
| Statistic | Count Raw |
Tucson / 100k People |
Arizona / 100k People |
National / 100k People |
|---|---|---|---|---|
| Total Crimes Per 100K | 23,774 | 4,319.0 | 2,712.5 | 2,324.2 |
| Violent Crime | 3,843 | 698.2 | 484.8 | 369.8 |
| Murder | 61 | 11.1 | 6.9 | 6.3 |
| Robbery | 978 | 177.7 | 83.7 | 66.1 |
| Aggravated Assault | 2,341 | 425.3 | 350.2 | 268.2 |
| Property Crime | 19,931 | 3,620.9 | 2,227.7 | 1,954.4 |
| Burglary | 2,097 | 381.0 | 330.0 | 269.8 |
| Larceny | 15,956 | 2,898.7 | 1,656.0 | 1,401.9 |
| Car Theft | 1,878 | 341.2 | 241.7 | 282.7 |
Tucson, AZ Cost Of Living
95
Tucson's Overall Cost Of Living
Tucson's Overall Cost Of Living
0.9x
Lower Than The National Average
Lower Than The National Average
| Living Expense | Tucson | Arizona | National Average | |
|---|---|---|---|---|
| Overall | 95 | 107 | 100 | |
| Services | 106 | 102 | 100 | |
| Groceries | 103 | 101 | 100 | |
| Health | 103 | 94 | 100 | |
| Housing | 73 | 121 | 100 | |
| Transportation | 98 | 105 | 100 | |
| Utilities | 100 | 97 | 100 | |
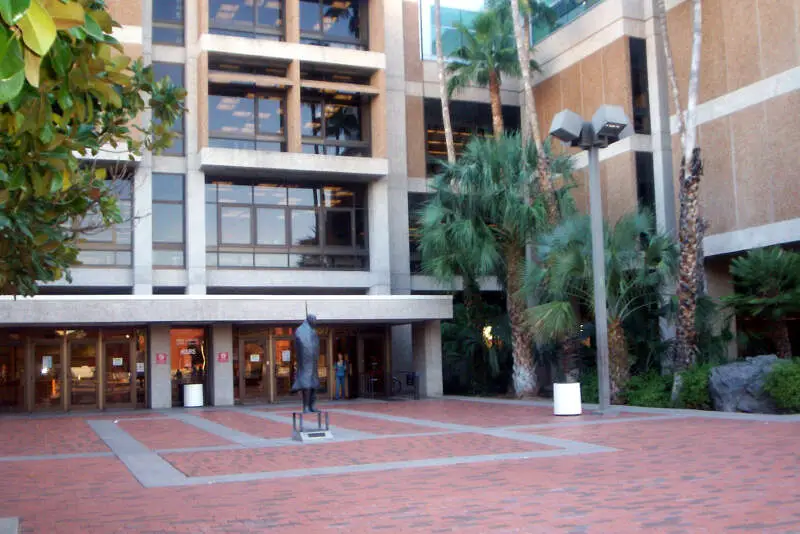
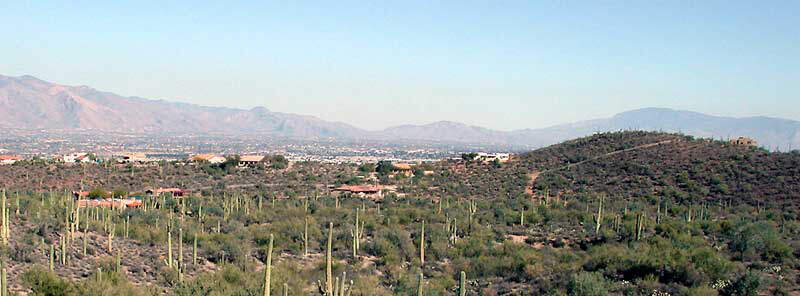
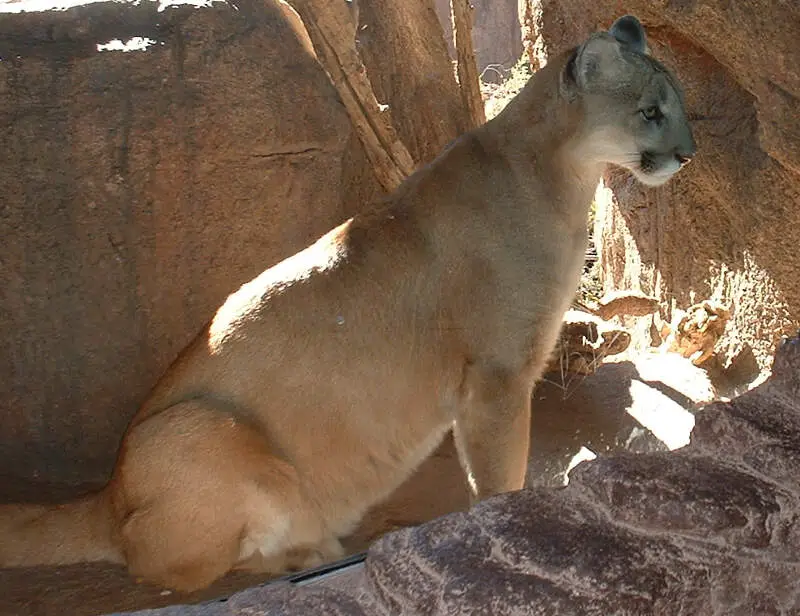
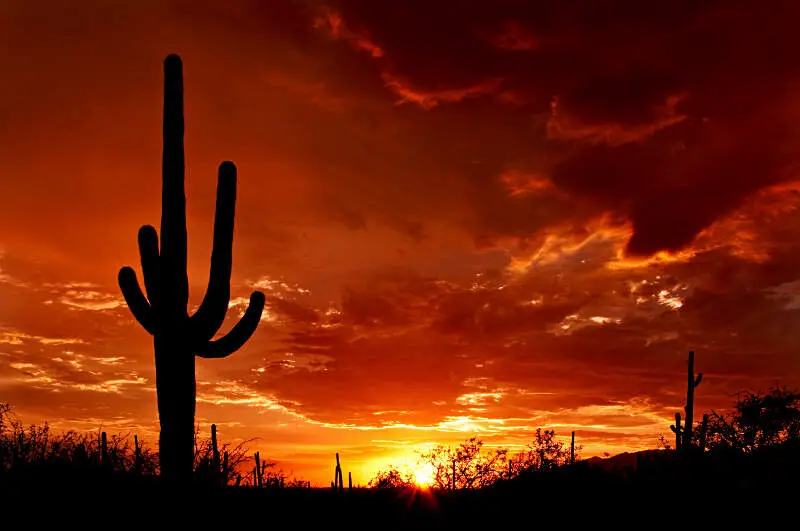
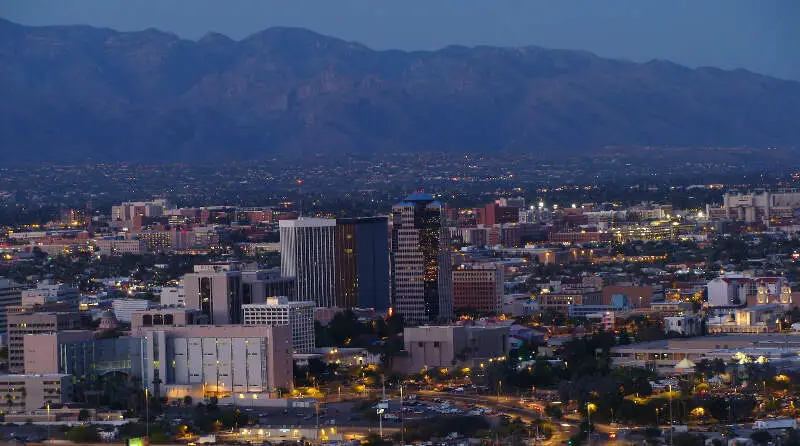
Tucson, AZ Photos

Source: Public Domain
Source: Public Domain
Source: Wikipedia User | GFDL
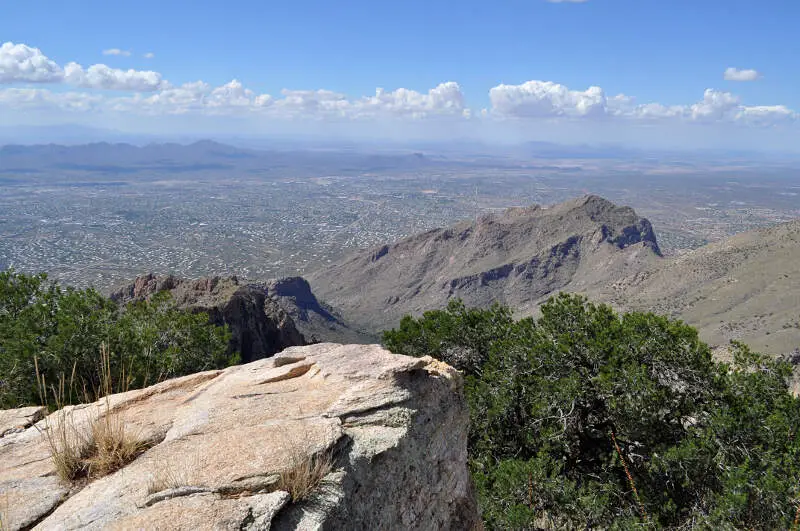
Source: Wikipedia User Matthew Schallan | CC BY-SA 3.0
Source: Wikipedia User Saguaro Pictures | CC BY 3.0
Source: Wikipedia User Zereshk | GFDL

Source: Wikipedia User |
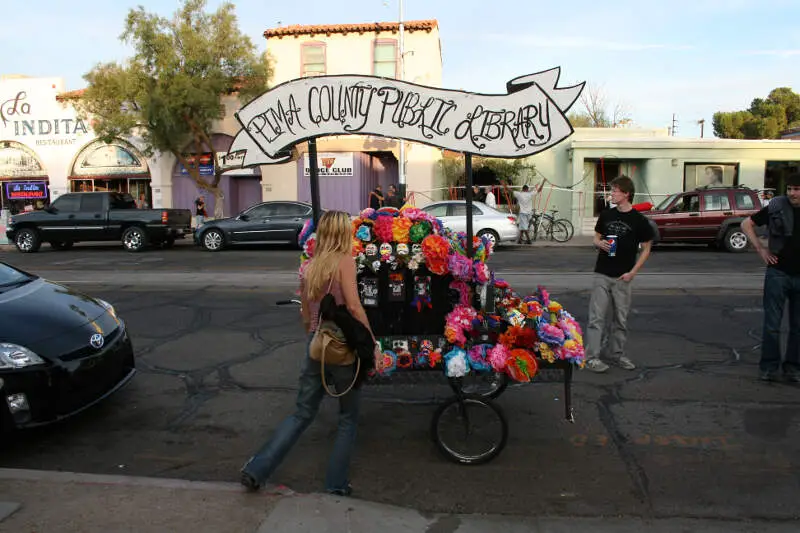
Source: Wikipedia User John from tucson az | CC BY 2.0
Tucson Articles

Rankings for Tucson in Arizona


Map Of Tucson, AZ
Best Places Around Tucson
1
Oro Valley, AZ
Population 46,515
2
Corona de Tucson, AZ
Population 9,627
3
Catalina Foothills, AZ
Population 50,096
4
Vail, AZ
Population 14,715
5
Tanque Verde, AZ
Population 14,946
6
Sahuarita, AZ
Population 33,524
7
Casas Adobes, AZ
Population 70,224
8
Tucson Estates, AZ
Population 12,411
9
Valencia West, AZ
Population 12,887
10
Drexel Heights, AZ
Population 30,599
Population over time in Tucson
| Year | Population | % Change |
|---|---|---|
| 2021 | 545,340 | 1.1% |
| 2020 | 539,216 | 1.6% |
| 2019 | 530,905 | 0.6% |
| 2018 | 527,586 | -0.1% |
| 2017 | 528,374 | 0.6% |
| 2016 | 525,031 | 0.3% |
| 2015 | 523,278 | 0.3% |
| 2014 | 521,695 | 0.1% |
| 2013 | 520,981 | 0.5% |
| 2012 | 518,457 | - |
Race / Ethnicity in Tucson
| Race | Tucson | AZ | USA |
|---|---|---|---|
| White | 42.6% | 53.4% | 59.4% |
| African American | 4.4% | 4.2% | 12.2% |
| American Indian | 1.7% | 3.6% | 0.6% |
| Asian | 3.0% | 3.2% | 5.6% |
| Hawaiian | 0.2% | 0.2% | 0.2% |
| Other | 0.2% | 0.3% | 0.4% |
| Two Or More | 3.4% | 3.2% | 3.2% |
| Hispanic | 44.6% | 31.9% | 18.4% |
Gender in Tucson
| Gender | Tucson | AZ | USA |
|---|---|---|---|
| Female | 50.3% | 50.1% | 50.5% |
| Male | 49.7% | 49.9% | 49.5% |
Highest level of educational attainment in Tucson for adults over 25
| Education | Tucson | AZ | USA |
|---|---|---|---|
| < 9th Grade | 6.0% | 5.0% | 5.0% |
| 9-12th Grade | 8.0% | 7.0% | 6.0% |
| High School / GED | 23.0% | 23.0% | 26.0% |
| Some College | 26.0% | 25.0% | 20.0% |
| Associate's Degree | 9.0% | 9.0% | 9.0% |
| Bachelor's Degree | 17.0% | 19.0% | 21.0% |
| Master's Degree | 8.0% | 9.0% | 9.0% |
| Professional Degree | 1.0% | 2.0% | 2.0% |
| Doctorate Degree | 2.0% | 1.0% | 2.0% |
Household Income For Tucson, Arizona
| Income | Tucson | AZ | USA |
|---|---|---|---|
| Less than $10,000 | 8.3% | 5.5% | 5.5% |
| $10,000 to $14,999 | 5.6% | 3.4% | 3.9% |
| $15,000 to $24,999 | 11.4% | 7.7% | 7.8% |
| $25,000 to $34,999 | 11.3% | 8.5% | 8.2% |
| $35,000 to $49,999 | 15.2% | 12.6% | 11.4% |
| $50,000 to $74,999 | 18.1% | 18.2% | 16.8% |
| $75,000 to $99,999 | 12.0% | 13.5% | 12.8% |
| $100,000 to $149,999 | 11.7% | 16.3% | 16.3% |
| $150,000 to $199,999 | 3.6% | 7.0% | 7.8% |
| $200,000 or more | 2.8% | 7.4% | 9.5% |


