Cupertino, CA
Quality of Life, Demographics, And Statistics
Living In Cupertino, California Summary
Life in Cupertino research summary. HomeSnacks has been researching the quality of life in Cupertino over the past eight years using Census data, FBI crime data, cost of living data, and other primary sources. Based on the most recently available data, we found the following about life in Cupertino:
The population in Cupertino is 60,681.
The median home value in Cupertino is $2,000,001.
The median income in Cupertino is $199,778.
The cost of living in Cupertino is 252 which is 2.5x higher than the national average.
The median rent in Cupertino is $3,450.
The unemployment rate in Cupertino is 2.5%.
The poverty rate in Cupertino is 5.1%.
Table Of Contents
Cupertino SnackAbility
10
Overall SnackAbility
Overall SnackAbility
Jobs
9/10
Housing
10
Affordability
4
Diversity
8.5
Safety
8
Amenities
9.5
Education
9.5
Commute
5
Cupertino, CA Crime Report
824
Total Crimes
Total Crimes
1,446.9
Total Crimes / 100k People
Total Crimes / 100k People
-37.75%
Below National Average
Below National Average
| Statistic | Count Raw |
Cupertino / 100k People |
California / 100k People |
National / 100k People |
|---|---|---|---|---|
| Total Crimes Per 100K | 824 | 1,446.9 | 2,581.0 | 2,324.2 |
| Violent Crime | 66 | 115.9 | 442.0 | 369.8 |
| Murder | 1 | 1.8 | 5.6 | 6.3 |
| Robbery | 18 | 31.6 | 113.6 | 66.1 |
| Aggravated Assault | 32 | 56.2 | 288.7 | 268.2 |
| Property Crime | 758 | 1,331.0 | 2,138.9 | 1,954.4 |
| Burglary | 161 | 282.7 | 369.7 | 269.8 |
| Larceny | 535 | 939.4 | 1,341.7 | 1,401.9 |
| Car Theft | 62 | 108.9 | 427.6 | 282.7 |
Cupertino, CA Cost Of Living
252
Cupertino's Overall Cost Of Living
Cupertino's Overall Cost Of Living
2.5x
Higher Than The National Average
Higher Than The National Average
| Living Expense | Cupertino | California | National Average | |
|---|---|---|---|---|
| Overall | 252 | 139 | 100 | |
| Services | 116 | 110 | 100 | |
| Groceries | 132 | 112 | 100 | |
| Health | 124 | 109 | 100 | |
| Housing | 543 | 204 | 100 | |
| Transportation | 145 | 126 | 100 | |
| Utilities | 138 | 124 | 100 | |
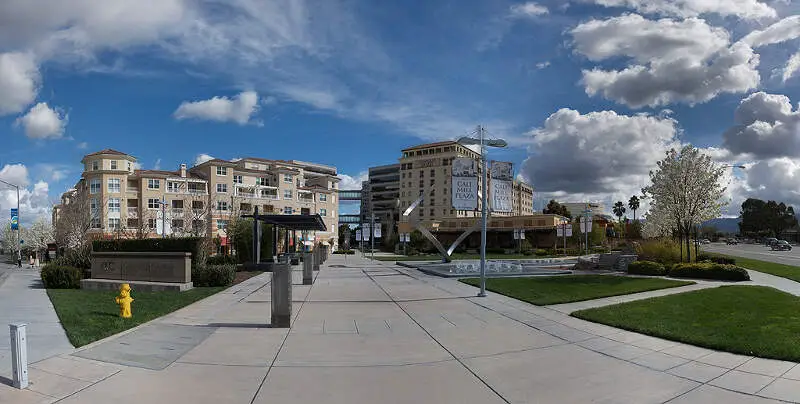
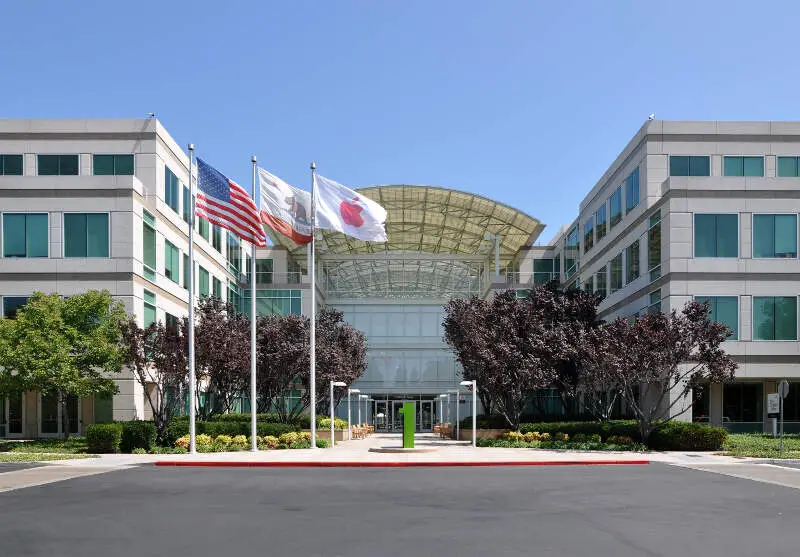
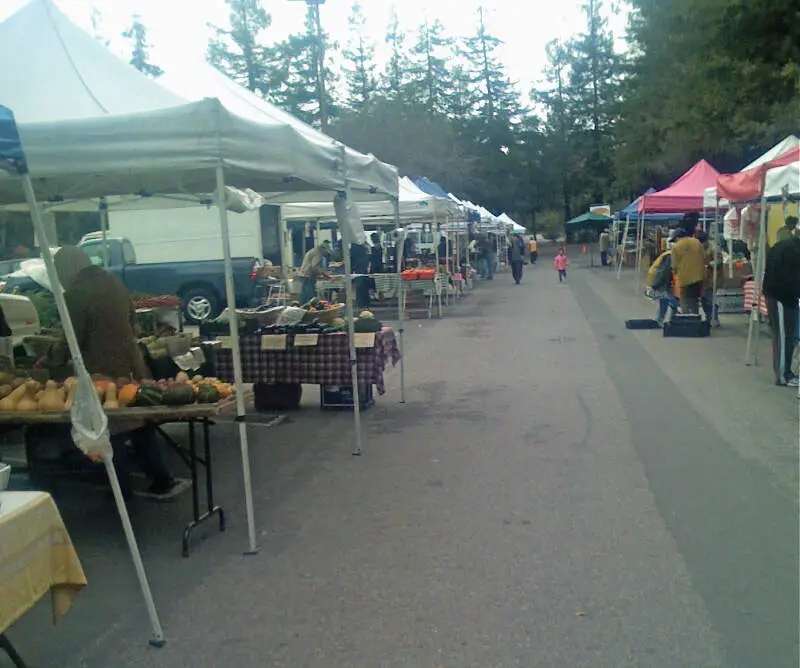
Cupertino, CA Photos
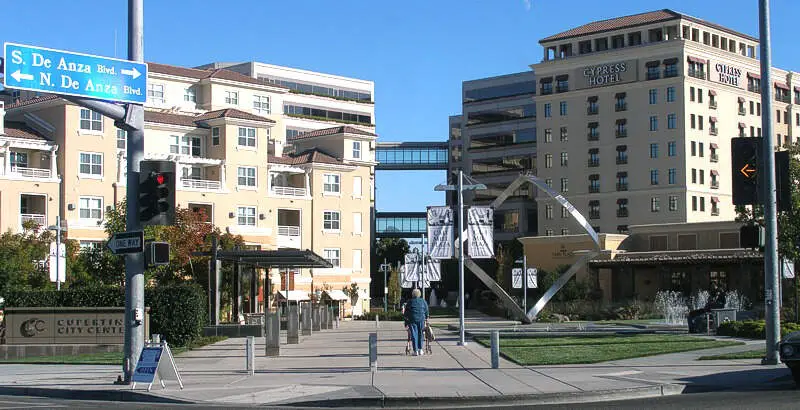
Source: Wikipedia User Coolcaesar at en.wikipedi | GFDL

Source: Public Domain
Source: Wikipedia User Antipex | GFDL

Source: Wikipedia User Kaisenl (talk) | CC BY-SA 3.0
Source: Wikipedia User Alison Cassidy | GFDL
Rankings for Cupertino in California


Map Of Cupertino, CA
Best Places Around Cupertino
1
East Foothills, CA
Population 7,391
2
San Carlos, CA
Population 30,754
3
Los Altos, CA
Population 31,562
4
Belmont, CA
Population 28,109
5
Sunnyvale, CA
Population 155,550
6
North Fair Oaks, CA
Population 14,360
7
Menlo Park, CA
Population 33,677
8
Santa Clara, CA
Population 127,922
9
Mountain View, CA
Population 82,409
10
Saratoga, CA
Population 31,194
Population over time in Cupertino
| Year | Population | % Change |
|---|---|---|
| 2021 | 59,799 | -1.3% |
| 2020 | 60,614 | -0.1% |
| 2019 | 60,687 | 0.6% |
| 2018 | 60,297 | 0.2% |
| 2017 | 60,171 | 0.6% |
| 2016 | 59,787 | 1.2% |
| 2015 | 59,080 | 1.1% |
| 2014 | 58,409 | 1.7% |
| 2013 | 57,459 | 1.7% |
| 2012 | 56,498 | - |
Race / Ethnicity in Cupertino
| Race | Cupertino | CA | USA |
|---|---|---|---|
| White | 22.5% | 35.8% | 59.4% |
| African American | 1.1% | 5.4% | 12.2% |
| American Indian | 0.0% | 0.3% | 0.6% |
| Asian | 69.3% | 14.7% | 5.6% |
| Hawaiian | 0.4% | 0.3% | 0.2% |
| Other | 0.2% | 0.4% | 0.4% |
| Two Or More | 3.5% | 3.6% | 3.2% |
| Hispanic | 3.0% | 39.5% | 18.4% |
Gender in Cupertino
| Gender | Cupertino | CA | USA |
|---|---|---|---|
| Female | 48.2% | 50.0% | 50.5% |
| Male | 51.8% | 50.0% | 49.5% |
Highest level of educational attainment in Cupertino for adults over 25
| Education | Cupertino | CA | USA |
|---|---|---|---|
| < 9th Grade | 2.0% | 8.0% | 5.0% |
| 9-12th Grade | 1.0% | 7.0% | 6.0% |
| High School / GED | 4.0% | 20.0% | 26.0% |
| Some College | 7.0% | 21.0% | 20.0% |
| Associate's Degree | 5.0% | 8.0% | 9.0% |
| Bachelor's Degree | 33.0% | 22.0% | 21.0% |
| Master's Degree | 35.0% | 9.0% | 9.0% |
| Professional Degree | 4.0% | 3.0% | 2.0% |
| Doctorate Degree | 9.0% | 2.0% | 2.0% |
Household Income For Cupertino, California
| Income | Cupertino | CA | USA |
|---|---|---|---|
| Less than $10,000 | 3.4% | 4.6% | 5.5% |
| $10,000 to $14,999 | 1.9% | 3.6% | 3.9% |
| $15,000 to $24,999 | 3.4% | 6.2% | 7.8% |
| $25,000 to $34,999 | 3.0% | 6.7% | 8.2% |
| $35,000 to $49,999 | 3.2% | 9.4% | 11.4% |
| $50,000 to $74,999 | 6.3% | 14.7% | 16.8% |
| $75,000 to $99,999 | 5.8% | 12.3% | 12.8% |
| $100,000 to $149,999 | 10.8% | 17.5% | 16.3% |
| $150,000 to $199,999 | 12.2% | 9.9% | 7.8% |
| $200,000 or more | 49.9% | 15.1% | 9.5% |


