San Clemente, CA
Quality of Life, Demographics, And Statistics
Living In San Clemente, California Summary
Life in San Clemente research summary. HomeSnacks has been researching the quality of life in San Clemente over the past eight years using Census data, FBI crime data, cost of living data, and other primary sources. Based on the most recently available data, we found the following about life in San Clemente:
The population in San Clemente is 64,600.
The median home value in San Clemente is $975,300.
The median income in San Clemente is $123,090.
The cost of living in San Clemente is 185 which is 1.9x higher than the national average.
The median rent in San Clemente is $2,094.
The unemployment rate in San Clemente is 4.6%.
The poverty rate in San Clemente is 5.3%.
Table Of Contents
San Clemente SnackAbility
9.5
Overall SnackAbility
Overall SnackAbility
Jobs
8.5/10
Housing
10
Affordability
4
Diversity
8
Safety
8
Amenities
9.5
Education
9
Commute
5
San Clemente, CA Crime Report
896
Total Crimes
Total Crimes
1,412.2
Total Crimes / 100k People
Total Crimes / 100k People
-39.24%
Below National Average
Below National Average
| Statistic | Count Raw |
San Clemente / 100k People |
California / 100k People |
National / 100k People |
|---|---|---|---|---|
| Total Crimes Per 100K | 896 | 1,412.2 | 2,581.0 | 2,324.2 |
| Violent Crime | 118 | 186.0 | 442.0 | 369.8 |
| Murder | 0 | 0.0 | 5.6 | 6.3 |
| Robbery | 23 | 36.2 | 113.6 | 66.1 |
| Aggravated Assault | 88 | 138.7 | 288.7 | 268.2 |
| Property Crime | 778 | 1,226.2 | 2,138.9 | 1,954.4 |
| Burglary | 112 | 176.5 | 369.7 | 269.8 |
| Larceny | 528 | 832.2 | 1,341.7 | 1,401.9 |
| Car Theft | 138 | 217.5 | 427.6 | 282.7 |
San Clemente, CA Cost Of Living
185
San Clemente's Overall Cost Of Living
San Clemente's Overall Cost Of Living
1.9x
Higher Than The National Average
Higher Than The National Average
| Living Expense | San Clemente | California | National Average | |
|---|---|---|---|---|
| Overall | 185 | 139 | 100 | |
| Services | 115 | 110 | 100 | |
| Groceries | 112 | 112 | 100 | |
| Health | 103 | 109 | 100 | |
| Housing | 357 | 204 | 100 | |
| Transportation | 137 | 126 | 100 | |
| Utilities | 88 | 124 | 100 | |
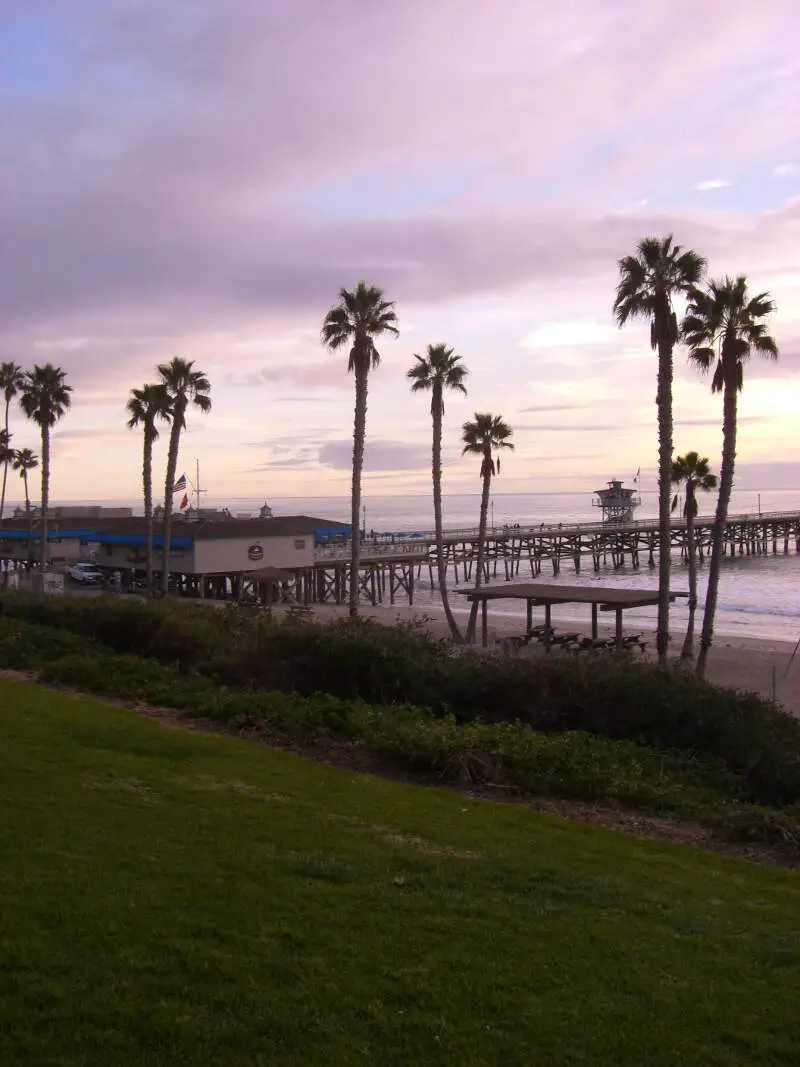
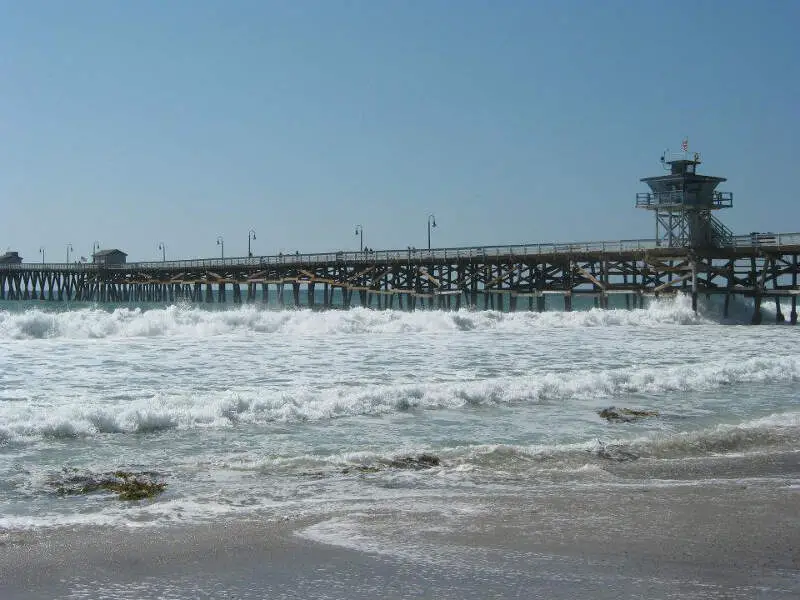
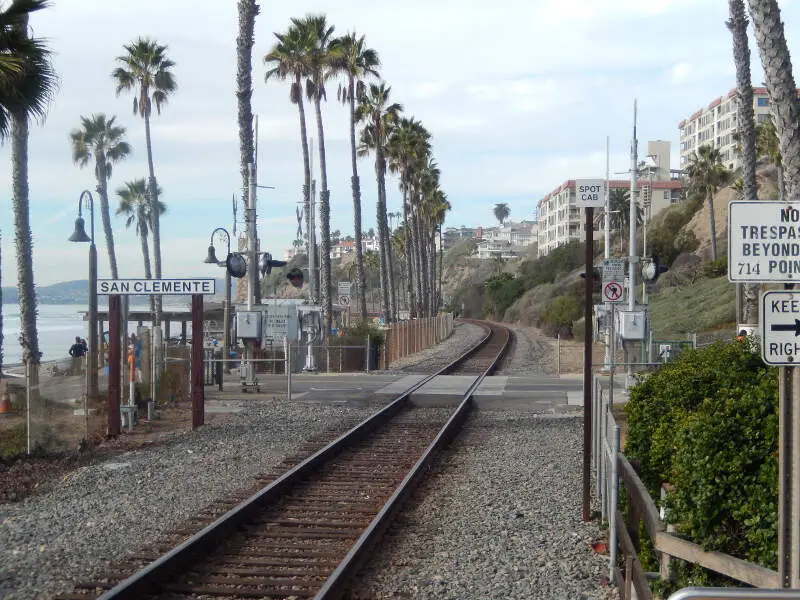
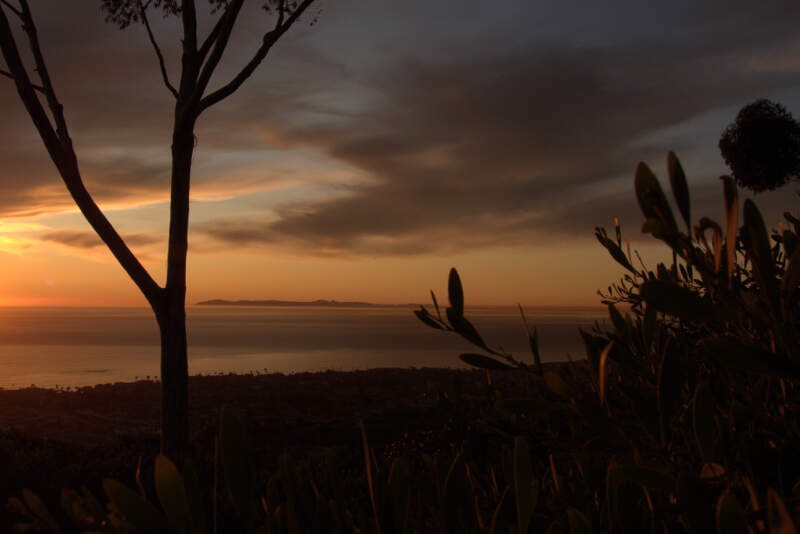
San Clemente, CA Photos
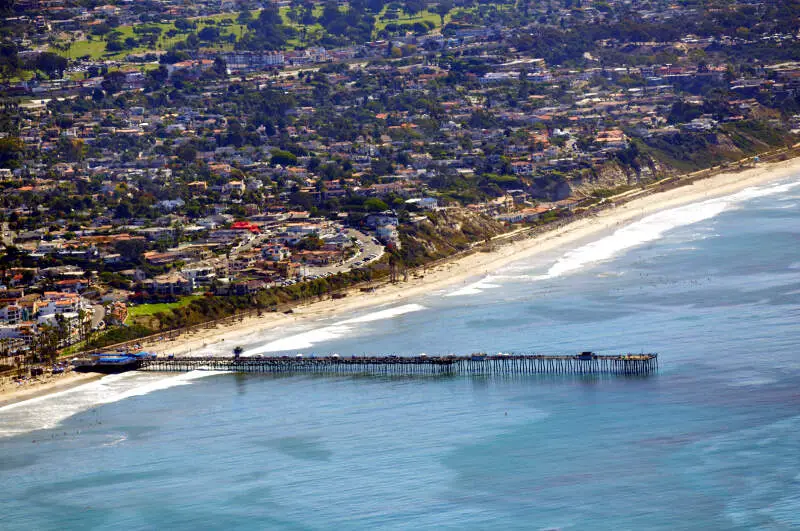
Source: Wikipedia User | CC BY-SA 3.0
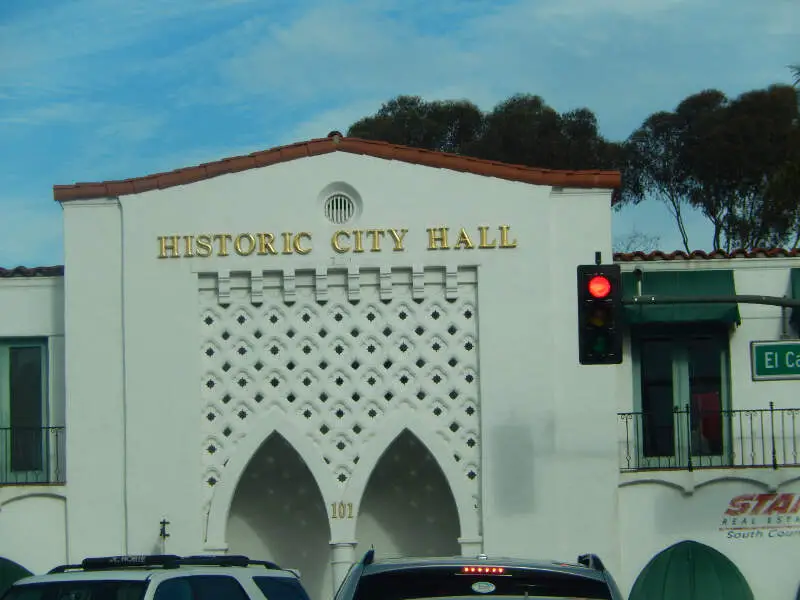
Source: Wikipedia User Billy Hathorn | CC BY-SA 3.0
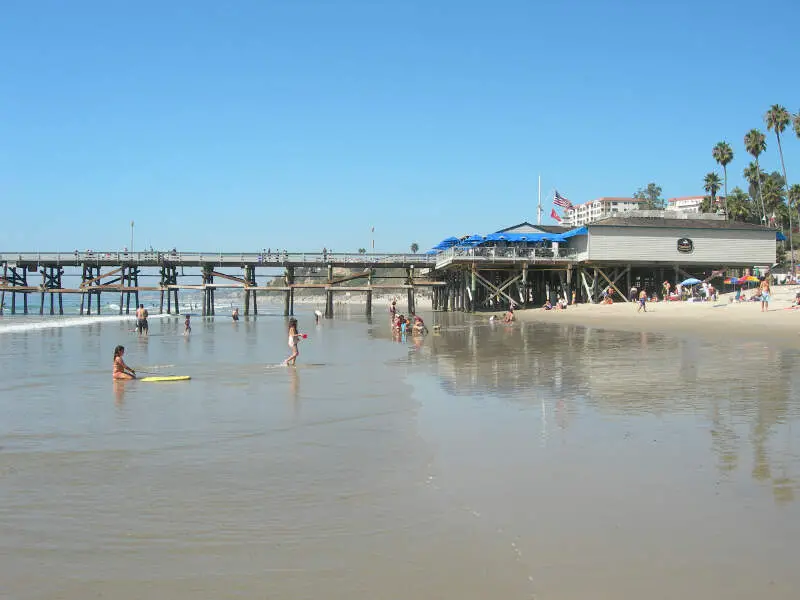
Source: Public Domain
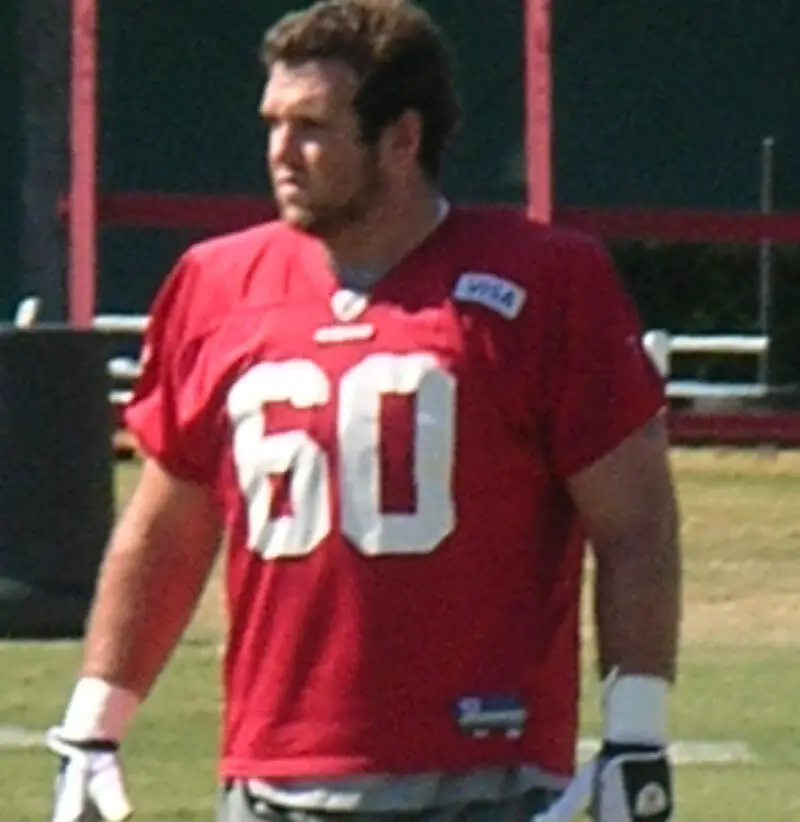
Source: Wikipedia User BrokenSphere | GFDL
Source: Wikipedia User Screaloc | CC BY 3.0
Source: Wikipedia User Shawnnielsen | CC BY-SA 3.0

Source: Wikipedia User Billy Hathorn | CC BY-SA 3.0
Source: Wikipedia User Billy Hathorn | CC BY-SA 3.0
Rankings for San Clemente in California


Map Of San Clemente, CA
Best Places Around San Clemente
1
Mission Viejo, CA
Population 93,932
2
Aliso Viejo, CA
Population 51,943
3
Rancho Santa Margarita, CA
Population 48,190
4
Lake Forest, CA
Population 85,516
5
Laguna Hills, CA
Population 31,409
6
Ladera Ranch, CA
Population 25,526
7
Irvine, CA
Population 297,868
8
Coto de Caza, CA
Population 15,873
9
Laguna Niguel, CA
Population 64,608
10
San Juan Capistrano, CA
Population 35,319
Population over time in San Clemente
| Year | Population | % Change |
|---|---|---|
| 2021 | 64,929 | -0.2% |
| 2020 | 65,045 | -0.3% |
| 2019 | 65,226 | 0.2% |
| 2018 | 65,082 | 0.1% |
| 2017 | 65,017 | 0.5% |
| 2016 | 64,673 | 1.1% |
| 2015 | 63,994 | 1.3% |
| 2014 | 63,187 | 1.8% |
| 2013 | 62,052 | 2.1% |
| 2012 | 60,774 | - |
Race / Ethnicity in San Clemente
| Race | San Clemente | CA | USA |
|---|---|---|---|
| White | 72.9% | 35.8% | 59.4% |
| African American | 1.5% | 5.4% | 12.2% |
| American Indian | 0.1% | 0.3% | 0.6% |
| Asian | 5.0% | 14.7% | 5.6% |
| Hawaiian | 0.0% | 0.3% | 0.2% |
| Other | 0.2% | 0.4% | 0.4% |
| Two Or More | 3.8% | 3.6% | 3.2% |
| Hispanic | 16.4% | 39.5% | 18.4% |
Gender in San Clemente
| Gender | San Clemente | CA | USA |
|---|---|---|---|
| Female | 49.3% | 50.0% | 50.5% |
| Male | 50.7% | 50.0% | 49.5% |
Highest level of educational attainment in San Clemente for adults over 25
| Education | San Clemente | CA | USA |
|---|---|---|---|
| < 9th Grade | 2.0% | 8.0% | 5.0% |
| 9-12th Grade | 2.0% | 7.0% | 6.0% |
| High School / GED | 13.0% | 20.0% | 26.0% |
| Some College | 22.0% | 21.0% | 20.0% |
| Associate's Degree | 10.0% | 8.0% | 9.0% |
| Bachelor's Degree | 30.0% | 22.0% | 21.0% |
| Master's Degree | 15.0% | 9.0% | 9.0% |
| Professional Degree | 4.0% | 3.0% | 2.0% |
| Doctorate Degree | 2.0% | 2.0% | 2.0% |
Household Income For San Clemente, California
| Income | San Clemente | CA | USA |
|---|---|---|---|
| Less than $10,000 | 3.5% | 4.6% | 5.5% |
| $10,000 to $14,999 | 3.0% | 3.6% | 3.9% |
| $15,000 to $24,999 | 3.3% | 6.2% | 7.8% |
| $25,000 to $34,999 | 4.4% | 6.7% | 8.2% |
| $35,000 to $49,999 | 6.2% | 9.4% | 11.4% |
| $50,000 to $74,999 | 9.3% | 14.7% | 16.8% |
| $75,000 to $99,999 | 12.4% | 12.3% | 12.8% |
| $100,000 to $149,999 | 16.7% | 17.5% | 16.3% |
| $150,000 to $199,999 | 12.9% | 9.9% | 7.8% |
| $200,000 or more | 28.3% | 15.1% | 9.5% |


