Simi Valley, CA
Quality of Life, Demographics, And Statistics
Living In Simi Valley, California Summary
Life in Simi Valley research summary. HomeSnacks has been researching the quality of life in Simi Valley over the past eight years using Census data, FBI crime data, cost of living data, and other primary sources. Based on the most recently available data, we found the following about life in Simi Valley:
The population in Simi Valley is 126,809.
The median home value in Simi Valley is $635,000.
The median income in Simi Valley is $102,627.
The cost of living in Simi Valley is 153 which is 1.5x higher than the national average.
The median rent in Simi Valley is $2,283.
The unemployment rate in Simi Valley is 4.8%.
The poverty rate in Simi Valley is 7.7%.
Table Of Contents
Simi Valley SnackAbility
9
Overall SnackAbility
Overall SnackAbility
Jobs
8.5/10
Housing
10
Affordability
3
Diversity
9
Safety
8
Amenities
9.5
Education
8
Commute
5
Simi Valley, CA Crime Report
1,188
Total Crimes
Total Crimes
946.0
Total Crimes / 100k People
Total Crimes / 100k People
-59.30%
Below National Average
Below National Average
| Statistic | Count Raw |
Simi Valley / 100k People |
California / 100k People |
National / 100k People |
|---|---|---|---|---|
| Total Crimes Per 100K | 1,188 | 946.0 | 2,581.0 | 2,324.2 |
| Violent Crime | 119 | 94.8 | 442.0 | 369.8 |
| Murder | 2 | 1.6 | 5.6 | 6.3 |
| Robbery | 17 | 13.5 | 113.6 | 66.1 |
| Aggravated Assault | 78 | 62.1 | 288.7 | 268.2 |
| Property Crime | 1,069 | 851.2 | 2,138.9 | 1,954.4 |
| Burglary | 174 | 138.6 | 369.7 | 269.8 |
| Larceny | 791 | 629.9 | 1,341.7 | 1,401.9 |
| Car Theft | 104 | 82.8 | 427.6 | 282.7 |
Simi Valley, CA Cost Of Living
153
Simi Valley's Overall Cost Of Living
Simi Valley's Overall Cost Of Living
1.5x
Higher Than The National Average
Higher Than The National Average
| Living Expense | Simi Valley | California | National Average | |
|---|---|---|---|---|
| Overall | 153 | 139 | 100 | |
| Services | 117 | 110 | 100 | |
| Groceries | 115 | 112 | 100 | |
| Health | 112 | 109 | 100 | |
| Housing | 233 | 204 | 100 | |
| Transportation | 136 | 126 | 100 | |
| Utilities | 109 | 124 | 100 | |
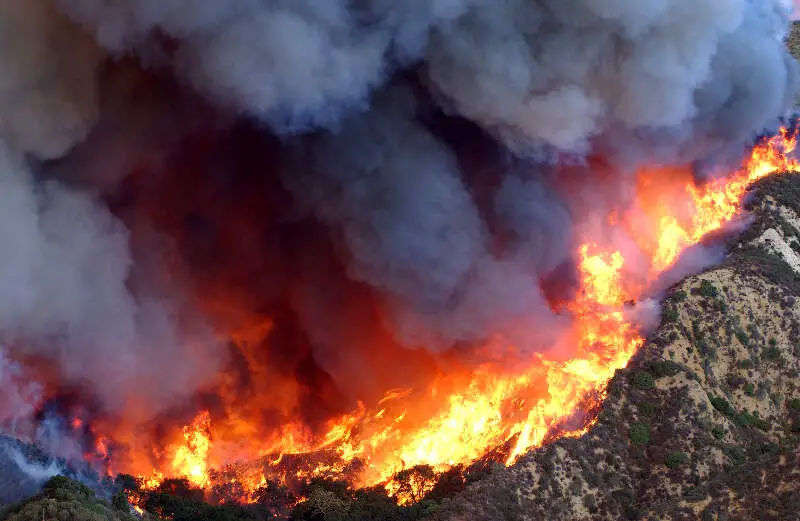
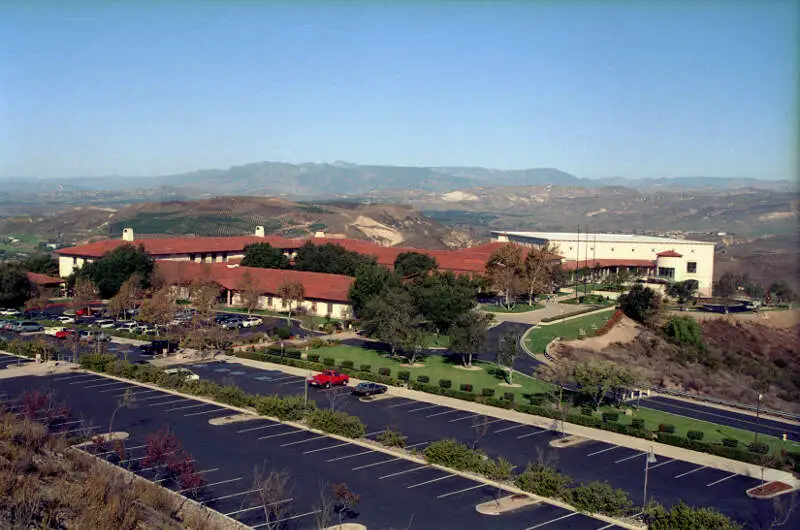
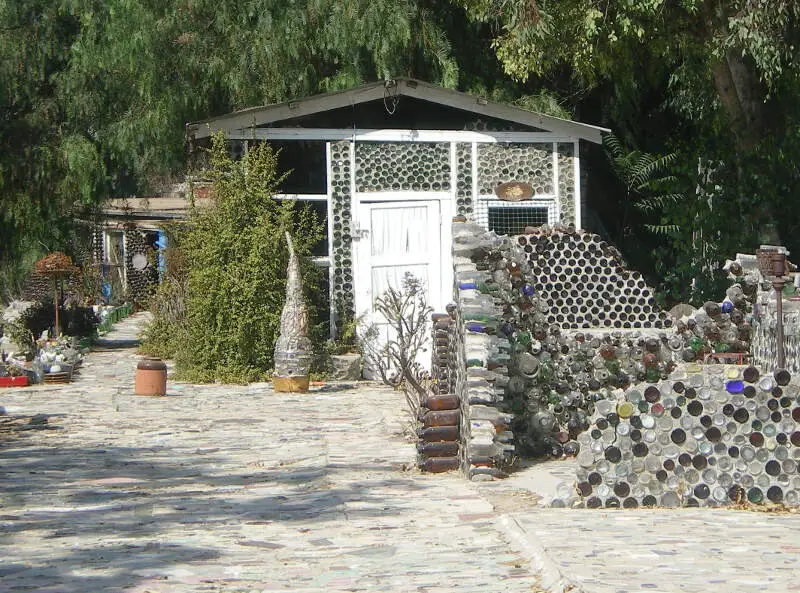
Simi Valley, CA Photos
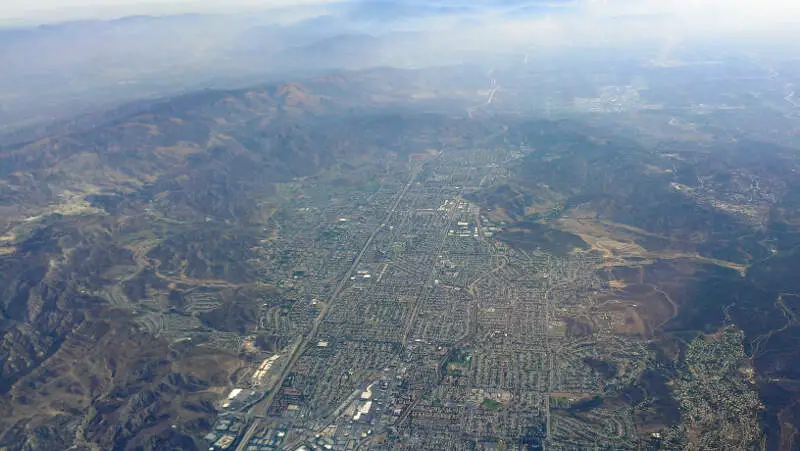
Source: Public Domain
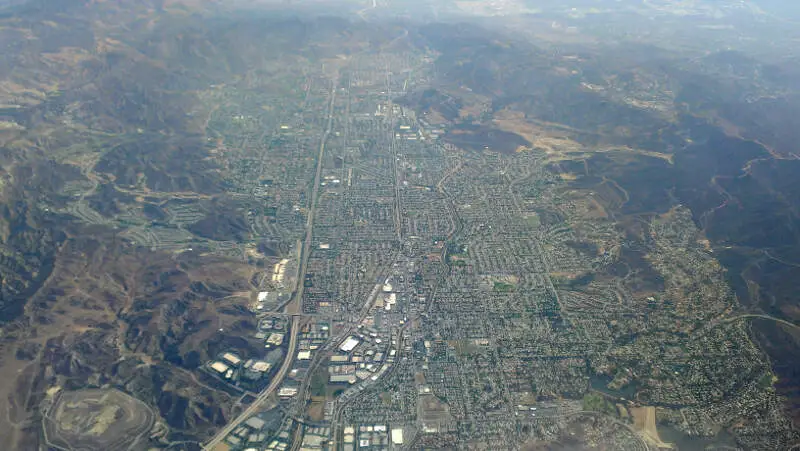
Source: Public Domain
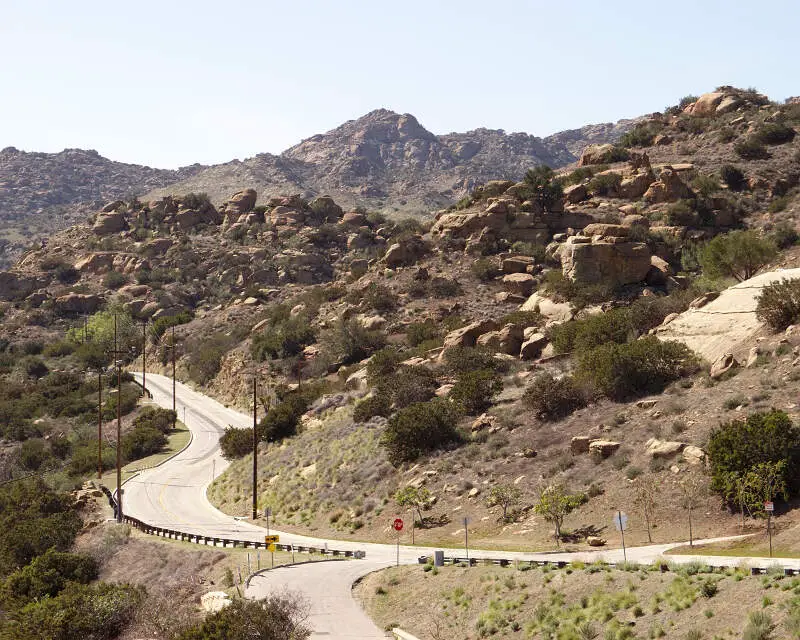
Source: Public Domain
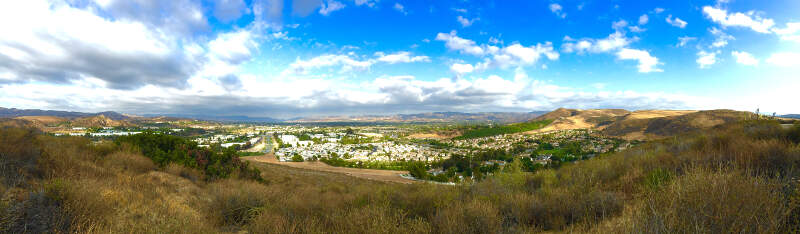
Source: Wikipedia User Niceley | CC BY-SA 4.0
Source: Public Domain

Source: Public Domain

Source: Wikipedia User Jrcrin001 | CC BY 3.0
Source: Public Domain
Source: Wikipedia User Los Angeles | CC BY-SA 3.0
Rankings for Simi Valley in California


Map Of Simi Valley, CA
Best Places Around Simi Valley
1
Camarillo, CA
Population 70,593
2
Agoura Hills, CA
Population 20,362
3
Moorpark, CA
Population 36,201
4
Oak Park, CA
Population 13,561
5
San Fernando, CA
Population 24,086
6
Santa Clarita, CA
Population 227,182
7
Castaic, CA
Population 18,017
8
Thousand Oaks, CA
Population 127,274
9
Stevenson Ranch, CA
Population 19,518
10
Calabasas, CA
Population 23,410
Population over time in Simi Valley
| Year | Population | % Change |
|---|---|---|
| 2021 | 125,768 | -0.3% |
| 2020 | 126,199 | -0.3% |
| 2019 | 126,546 | 0.3% |
| 2018 | 126,126 | 0.0% |
| 2017 | 126,103 | 0.3% |
| 2016 | 125,699 | 0.7% |
| 2015 | 124,803 | 0.7% |
| 2014 | 123,942 | 0.9% |
| 2013 | 122,864 | 1.0% |
| 2012 | 121,662 | - |
Race / Ethnicity in Simi Valley
| Race | Simi Valley | CA | USA |
|---|---|---|---|
| White | 57.6% | 35.8% | 59.4% |
| African American | 1.3% | 5.4% | 12.2% |
| American Indian | 0.1% | 0.3% | 0.6% |
| Asian | 11.1% | 14.7% | 5.6% |
| Hawaiian | 0.1% | 0.3% | 0.2% |
| Other | 0.1% | 0.4% | 0.4% |
| Two Or More | 3.8% | 3.6% | 3.2% |
| Hispanic | 25.8% | 39.5% | 18.4% |
Gender in Simi Valley
| Gender | Simi Valley | CA | USA |
|---|---|---|---|
| Female | 51.0% | 50.0% | 50.5% |
| Male | 49.0% | 50.0% | 49.5% |
Highest level of educational attainment in Simi Valley for adults over 25
| Education | Simi Valley | CA | USA |
|---|---|---|---|
| < 9th Grade | 3.0% | 8.0% | 5.0% |
| 9-12th Grade | 5.0% | 7.0% | 6.0% |
| High School / GED | 21.0% | 20.0% | 26.0% |
| Some College | 24.0% | 21.0% | 20.0% |
| Associate's Degree | 12.0% | 8.0% | 9.0% |
| Bachelor's Degree | 24.0% | 22.0% | 21.0% |
| Master's Degree | 8.0% | 9.0% | 9.0% |
| Professional Degree | 2.0% | 3.0% | 2.0% |
| Doctorate Degree | 1.0% | 2.0% | 2.0% |
Household Income For Simi Valley, California
| Income | Simi Valley | CA | USA |
|---|---|---|---|
| Less than $10,000 | 3.0% | 4.6% | 5.5% |
| $10,000 to $14,999 | 1.8% | 3.6% | 3.9% |
| $15,000 to $24,999 | 4.3% | 6.2% | 7.8% |
| $25,000 to $34,999 | 6.4% | 6.7% | 8.2% |
| $35,000 to $49,999 | 7.7% | 9.4% | 11.4% |
| $50,000 to $74,999 | 11.8% | 14.7% | 16.8% |
| $75,000 to $99,999 | 13.7% | 12.3% | 12.8% |
| $100,000 to $149,999 | 21.7% | 17.5% | 16.3% |
| $150,000 to $199,999 | 12.6% | 9.9% | 7.8% |
| $200,000 or more | 17.2% | 15.1% | 9.5% |


