Solvang, CA
Quality of Life, Demographics, And Statistics
Living In Solvang, California Summary
Life in Solvang research summary. HomeSnacks has been researching the quality of life in Solvang over the past eight years using Census data, FBI crime data, cost of living data, and other primary sources. Based on the most recently available data, we found the following about life in Solvang:
The population in Solvang is 6,032.
The median home value in Solvang is $779,300.
The median income in Solvang is $94,451.
The cost of living in Solvang is 171 which is 1.7x higher than the national average.
The median rent in Solvang is $1,479.
The unemployment rate in Solvang is 4.8%.
The poverty rate in Solvang is 6.7%.
Table Of Contents
Solvang SnackAbility
9
Overall SnackAbility
Overall SnackAbility
Jobs
8/10
Housing
9
Affordability
5
Diversity
8
Safety
8
Amenities
8
Education
8.5
Commute
6
Solvang, CA Crime Report
82
Total Crimes
Total Crimes
1,370.1
Total Crimes / 100k People
Total Crimes / 100k People
-41.05%
Below National Average
Below National Average
| Statistic | Count Raw |
Solvang / 100k People |
California / 100k People |
National / 100k People |
|---|---|---|---|---|
| Total Crimes Per 100K | 82 | 1,370.1 | 2,581.0 | 2,324.2 |
| Violent Crime | 12 | 200.5 | 442.0 | 369.8 |
| Murder | 0 | 0.0 | 5.6 | 6.3 |
| Robbery | 1 | 16.7 | 113.6 | 66.1 |
| Aggravated Assault | 9 | 150.4 | 288.7 | 268.2 |
| Property Crime | 70 | 1,169.6 | 2,138.9 | 1,954.4 |
| Burglary | 13 | 217.2 | 369.7 | 269.8 |
| Larceny | 51 | 852.1 | 1,341.7 | 1,401.9 |
| Car Theft | 6 | 100.3 | 427.6 | 282.7 |
Solvang, CA Cost Of Living
171
Solvang's Overall Cost Of Living
Solvang's Overall Cost Of Living
1.7x
Higher Than The National Average
Higher Than The National Average
| Living Expense | Solvang | California | National Average | |
|---|---|---|---|---|
| Overall | 171 | 139 | 100 | |
| Services | 105 | 110 | 100 | |
| Groceries | 102 | 112 | 100 | |
| Health | 109 | 109 | 100 | |
| Housing | 298 | 204 | 100 | |
| Transportation | 128 | 126 | 100 | |
| Utilities | 168 | 124 | 100 | |
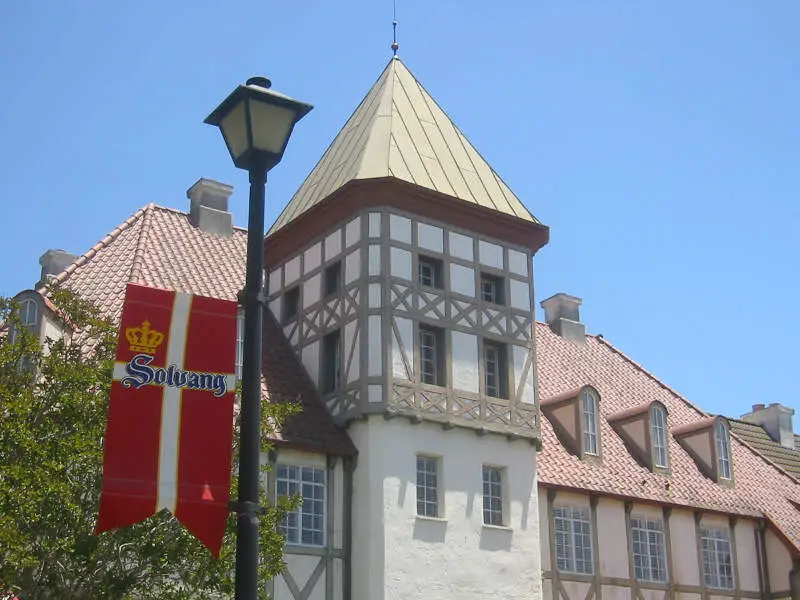
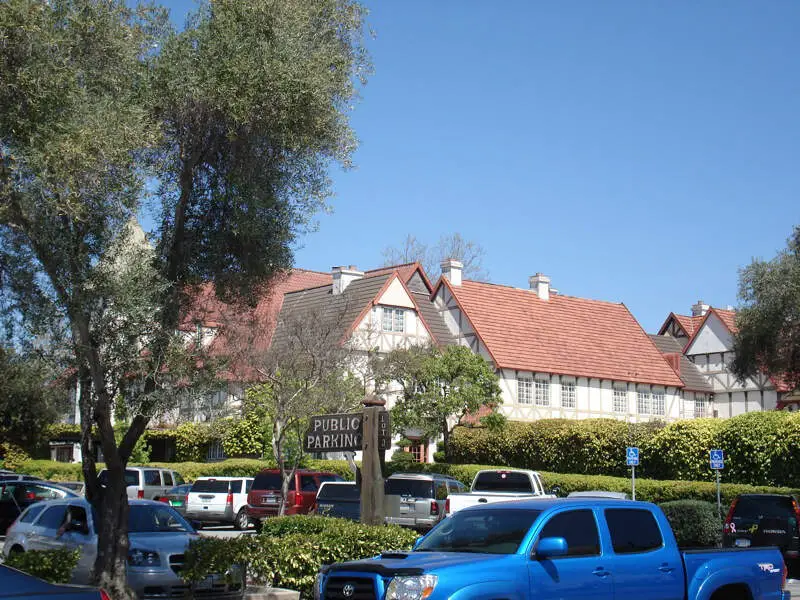
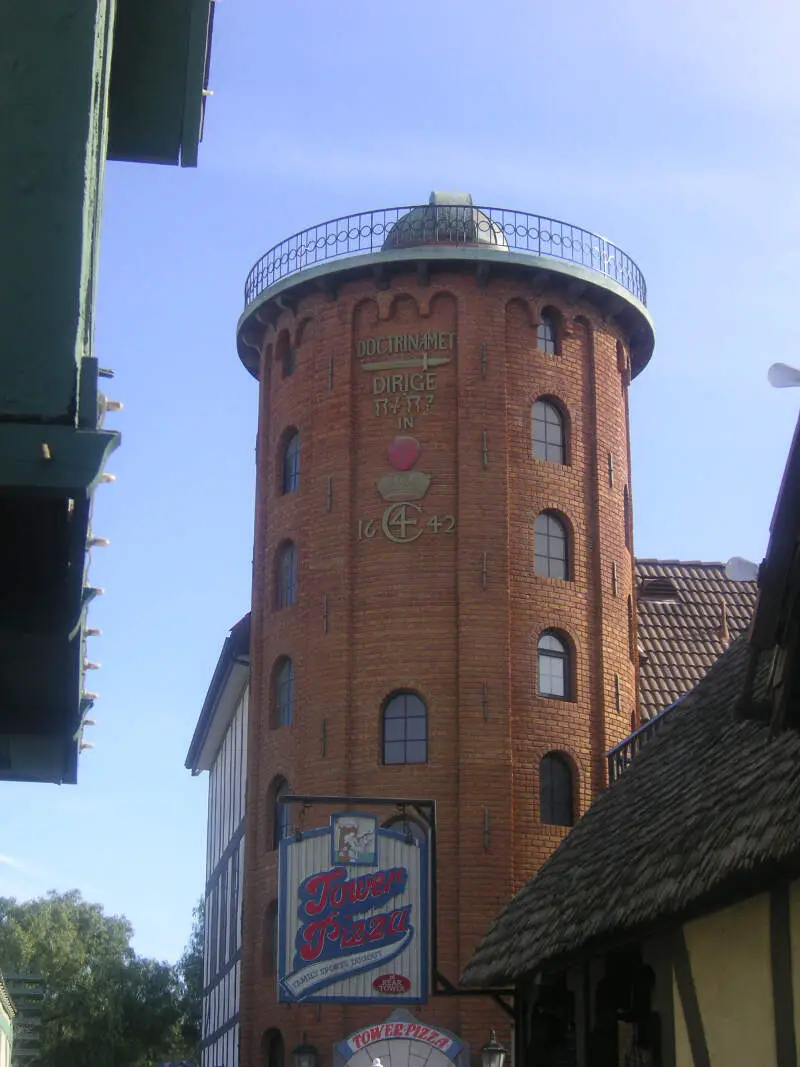
Solvang, CA Photos

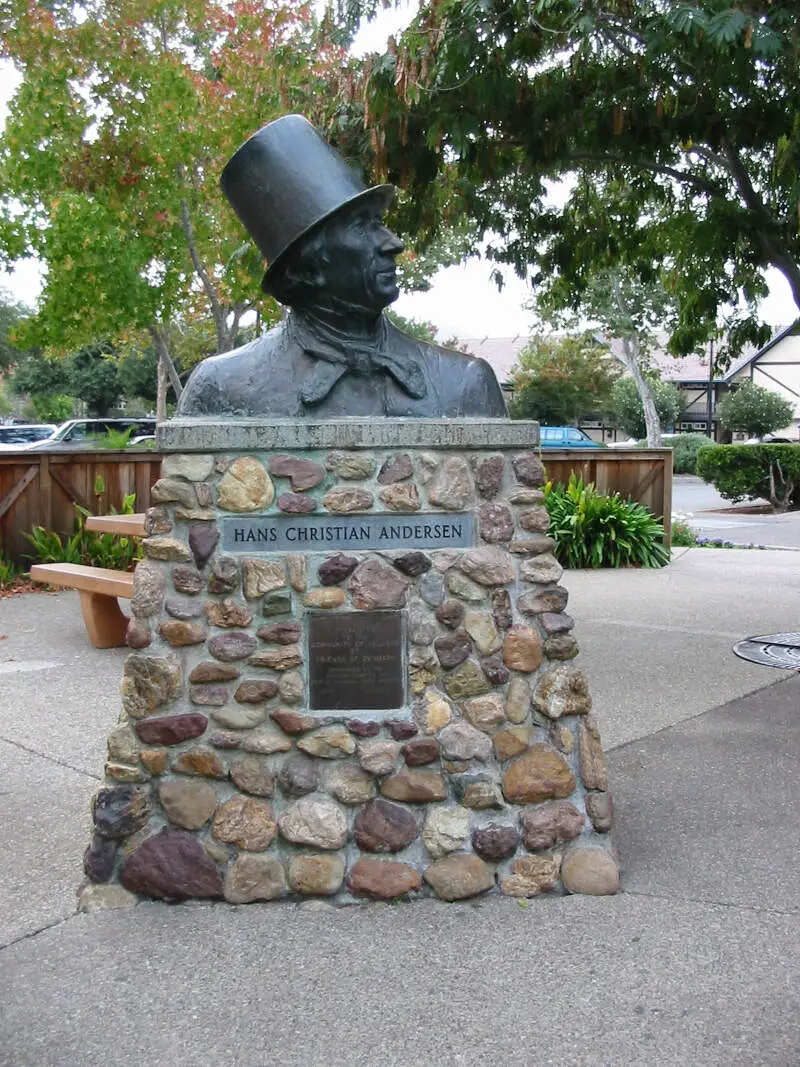
Source: Wikipedia User KNK | CC BY-SA 2.0
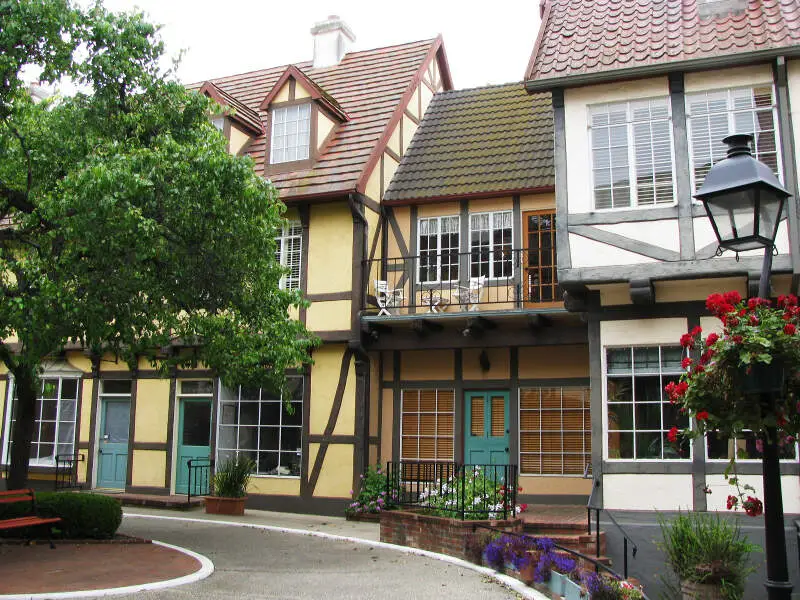
Source: Wikipedia User Kathy McGraw | CC BY 2.0

Source: Wikipedia User Klaus Nahr | CC BY-SA 2.0
Source: Wikipedia User Spencer Cross | CC BY-SA 2.0
Source: Wikipedia User kirinqueen | CC BY-SA 2.0
Source: Wikipedia User Shards Of Blue | CC BY-SA 2.0

Source: Wikipedia User Carolyn Williams | CC BY 2.0

Source: Wikipedia User Klaus Nahr | CC BY-SA 2.0
Rankings for Solvang in California


Map Of Solvang, CA
Best Places Around Solvang
1
Guadalupe, CA
Population 8,138
2
Goleta, CA
Population 32,677
3
Orcutt, CA
Population 30,940
4
Nipomo, CA
Population 18,440
5
Grover Beach, CA
Population 12,846
6
Carpinteria, CA
Population 13,289
7
Santa Barbara, CA
Population 89,132
8
Arroyo Grande, CA
Population 18,422
9
Oceano, CA
Population 7,371
10
Isla Vista, CA
Population 15,732
Population over time in Solvang
| Year | Population | % Change |
|---|---|---|
| 2021 | 5,644 | -1.6% |
| 2020 | 5,734 | 1.5% |
| 2019 | 5,650 | 1.8% |
| 2018 | 5,552 | 1.8% |
| 2017 | 5,456 | 2.1% |
| 2016 | 5,345 | 0.9% |
| 2015 | 5,298 | 0.7% |
| 2014 | 5,261 | 0.5% |
| 2013 | 5,237 | 0.4% |
| 2012 | 5,218 | - |
Race / Ethnicity in Solvang
| Race | Solvang | CA | USA |
|---|---|---|---|
| White | 69.9% | 35.8% | 59.4% |
| African American | 4.5% | 5.4% | 12.2% |
| American Indian | 0.0% | 0.3% | 0.6% |
| Asian | 1.9% | 14.7% | 5.6% |
| Hawaiian | 0.0% | 0.3% | 0.2% |
| Other | 0.0% | 0.4% | 0.4% |
| Two Or More | 3.6% | 3.6% | 3.2% |
| Hispanic | 20.1% | 39.5% | 18.4% |
Gender in Solvang
| Gender | Solvang | CA | USA |
|---|---|---|---|
| Female | 56.5% | 50.0% | 50.5% |
| Male | 43.5% | 50.0% | 49.5% |
Highest level of educational attainment in Solvang for adults over 25
| Education | Solvang | CA | USA |
|---|---|---|---|
| < 9th Grade | 4.0% | 8.0% | 5.0% |
| 9-12th Grade | 2.0% | 7.0% | 6.0% |
| High School / GED | 19.0% | 20.0% | 26.0% |
| Some College | 27.0% | 21.0% | 20.0% |
| Associate's Degree | 9.0% | 8.0% | 9.0% |
| Bachelor's Degree | 26.0% | 22.0% | 21.0% |
| Master's Degree | 10.0% | 9.0% | 9.0% |
| Professional Degree | 2.0% | 3.0% | 2.0% |
| Doctorate Degree | 1.0% | 2.0% | 2.0% |
Household Income For Solvang, California
| Income | Solvang | CA | USA |
|---|---|---|---|
| Less than $10,000 | 3.4% | 4.6% | 5.5% |
| $10,000 to $14,999 | 2.5% | 3.6% | 3.9% |
| $15,000 to $24,999 | 1.3% | 6.2% | 7.8% |
| $25,000 to $34,999 | 5.6% | 6.7% | 8.2% |
| $35,000 to $49,999 | 6.3% | 9.4% | 11.4% |
| $50,000 to $74,999 | 21.4% | 14.7% | 16.8% |
| $75,000 to $99,999 | 12.7% | 12.3% | 12.8% |
| $100,000 to $149,999 | 14.6% | 17.5% | 16.3% |
| $150,000 to $199,999 | 14.0% | 9.9% | 7.8% |
| $200,000 or more | 18.1% | 15.1% | 9.5% |


