Manitou Springs, CO
Quality of Life, Demographics, And Statistics
HomeSnacks is reader-supported. When you click through real estate links on our site, we earn an affiliate commission. Learn more.
Manitou Springs, Colorado Info Snack
Table Of Contents
Population
5,342
Unemployment
13.9%
Poverty
10.7%
Median Home
$415,400
Median Income
$65,933
Median Rent
$936
Manitou Springs SnackAbility
8
Overall SnackAbility
Overall SnackAbility
Jobs
6/10
Housing
8.5
Affordability
6
Diversity
6
Safety
6
Amenities
8
Education
9.5
Commute
6
Manitou Springs, CO Crime Report
111
Total Crimes
Total Crimes
2,042.3
Total Crimes / 100k People
Total Crimes / 100k People
-12.95%
Below National Average
Below National Average
| Statistic | Count Raw |
Manitou Springs / 100k People |
Colorado / 100k People |
National / 100k People |
|---|---|---|---|---|
| Total Crimes Per 100K | 111 | 2,042.3 | 3,256.9 | 2,346.0 |
| Violent Crime | 13 | 239.2 | 423.1 | 387.8 |
| Murder | 1 | 18.4 | 5.1 | 6.5 |
| Robbery | 2 | 36.8 | 68.3 | 73.9 |
| Aggravated Assault | 7 | 128.8 | 286.9 | 279.7 |
| Property Crime | 98 | 1,803.1 | 2,833.8 | 1,958.2 |
| Burglary | 9 | 165.6 | 400.3 | 314.2 |
| Larceny | 73 | 1,343.1 | 1,909.3 | 1,398.0 |
| Car Theft | 16 | 294.4 | 524.3 | 246.0 |
Manitou Springs, CO Cost Of Living
115
Manitou Springs's Overall Cost Of Living
Manitou Springs's Overall Cost Of Living
1.1x
Higher Than The National Average
Higher Than The National Average
| Living Expense | Manitou Springs | Colorado | National Average | |
|---|---|---|---|---|
| Overall | 115 | 112 | 100 | |
| Services | 101 | 104 | 100 | |
| Groceries | 97 | 103 | 100 | |
| Health | 107 | 103 | 100 | |
| Housing | 137 | 133 | 100 | |
| Transportation | 110 | 108 | 100 | |
| Utilities | 98 | 87 | 100 | |
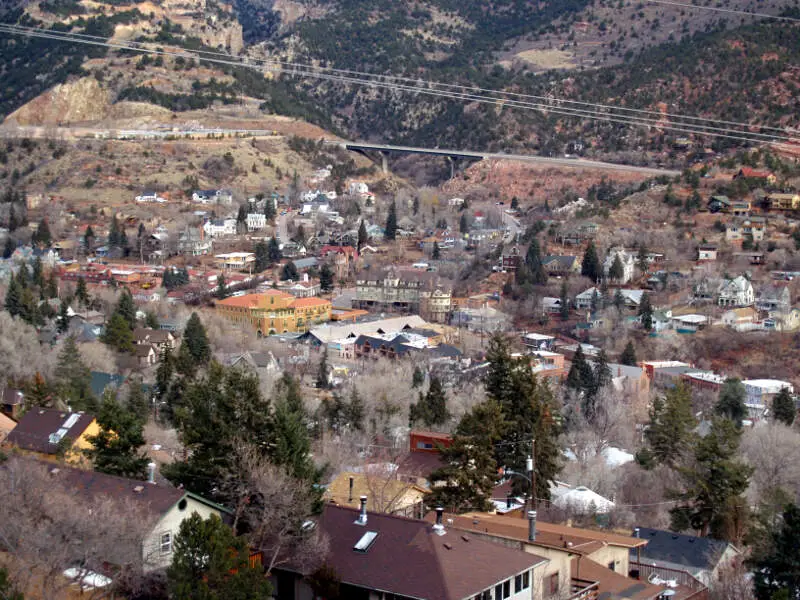
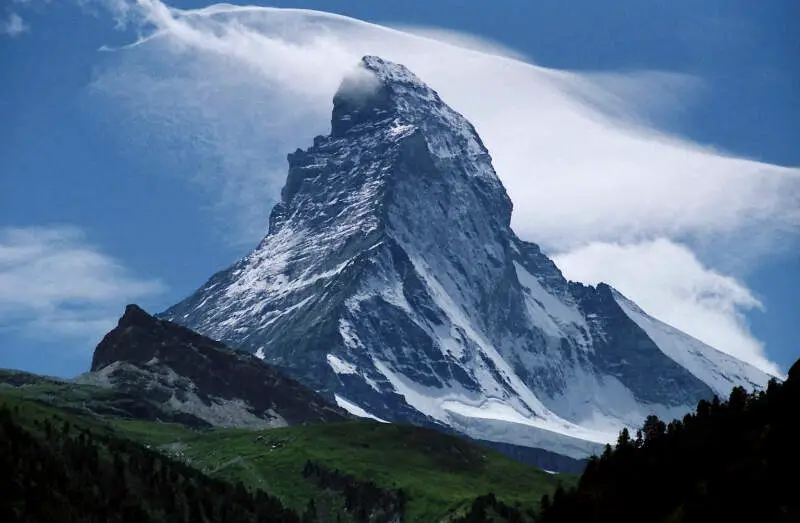
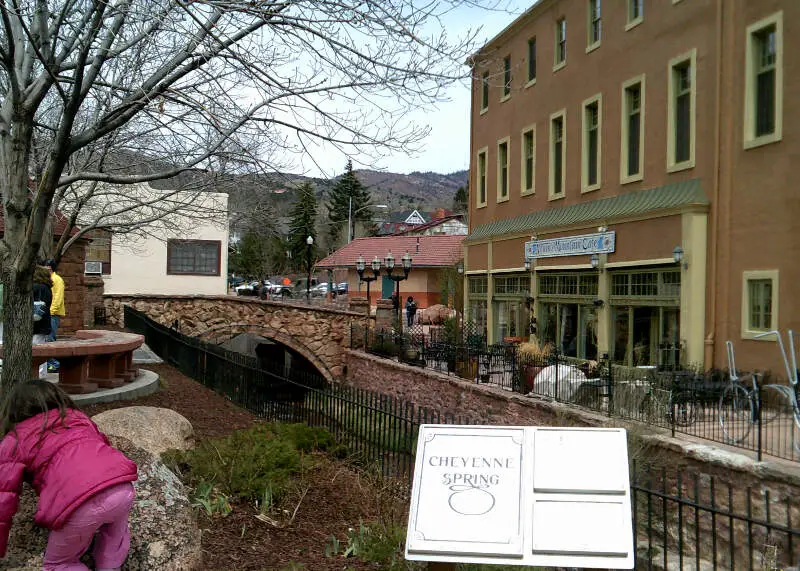
Manitou Springs, CO Photos
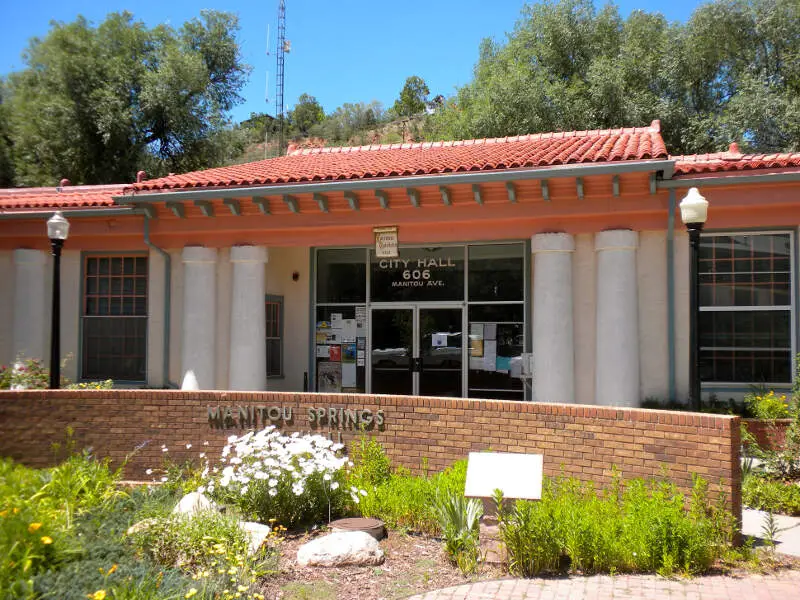
Source: Public Domain
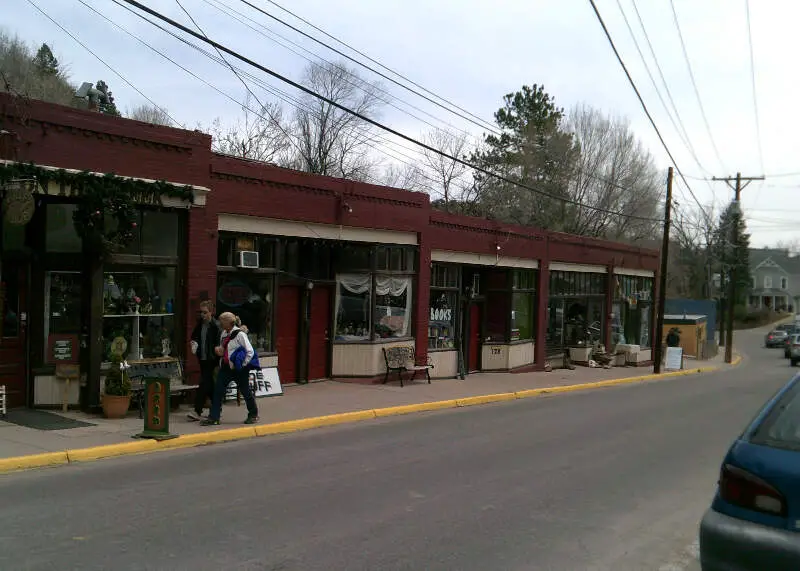
Source: Wikipedia User CaroleHenson | CC BY-SA 3.0
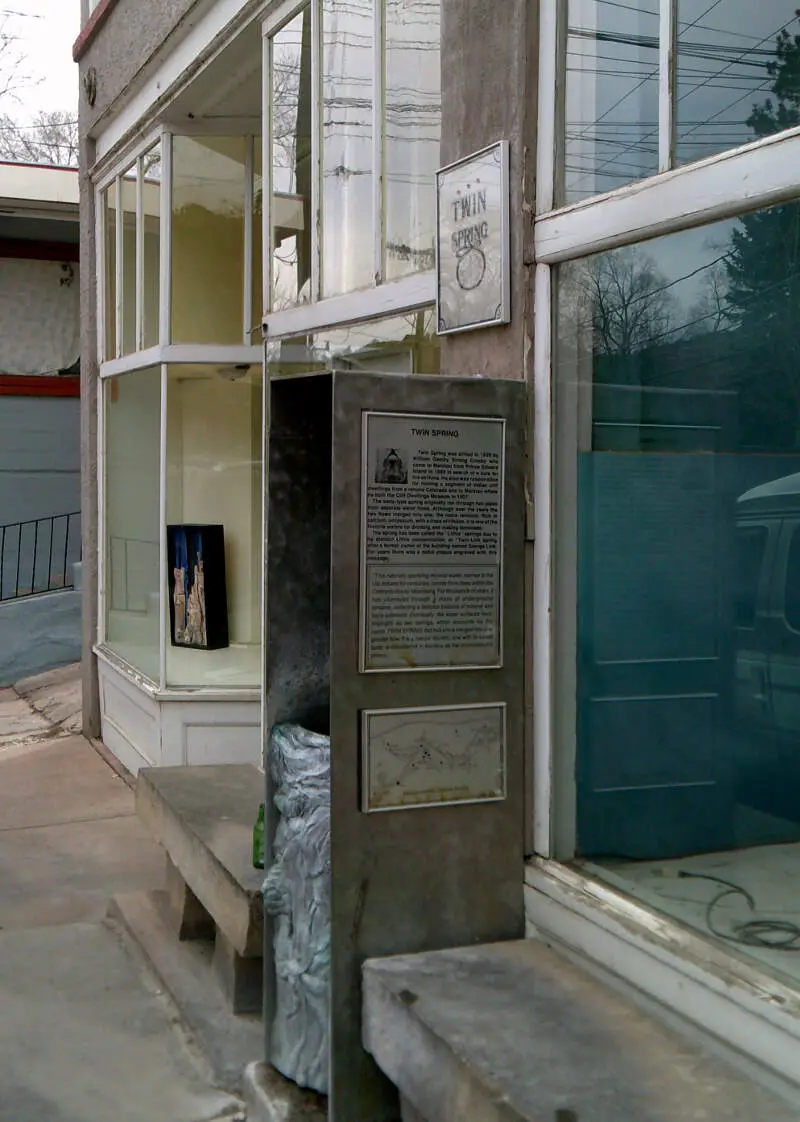
Source: Wikipedia User CaroleHenson | CC BY-SA 3.0
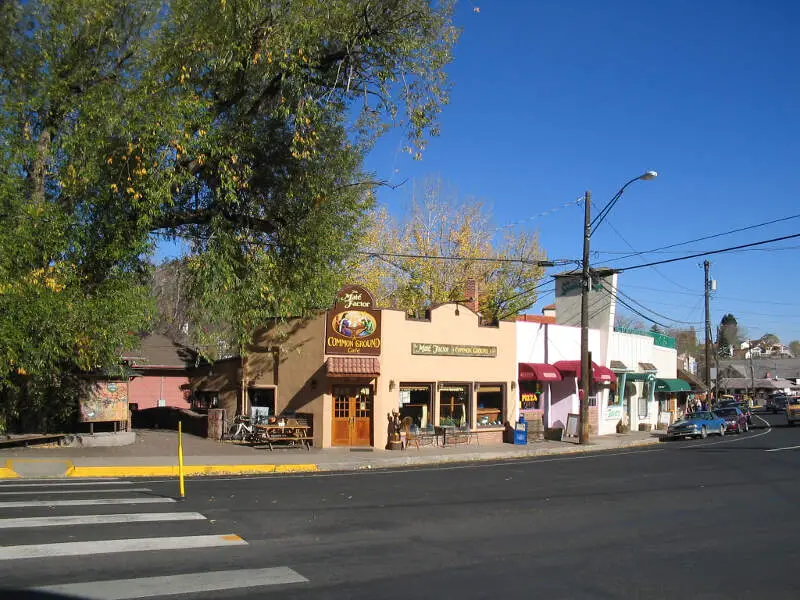
Source: Wikipedia User No machine-readable autho | GFDL

Source: Wikipedia User Matt Carpenter | CC BY-SA 3.0
Source: Wikipedia User David Shankbone | CC BY 3.0

Source: Wikipedia User CaroleHenson | CC BY-SA 3.0
Source: Public Domain
Source: Wikipedia User CaroleHenson | CC BY-SA 3.0
Rankings for Manitou Springs in Colorado


Map Of Manitou Springs, CO
Best Places Around Manitou Springs
1
Air Force Academy, CO
Population 6,368
2
Stratmoor, CO
Population 5,960
3
Colorado Springs, CO
Population 471,686
4
Fort Carson, CO
Population 16,243
5
Fountain, CO
Population 30,240
6
Woodland Park, CO
Population 7,943
7
Monument, CO
Population 7,691
8
Cimarron Hills, CO
Population 18,981
9
Black Forest, CO
Population 13,103
10
Woodmoor, CO
Population 8,474
Population over time in Manitou Springs
| Year | Population | % Change |
|---|---|---|
| 2020 | 5,342 | 1.2% |
| 2019 | 5,280 | 0.3% |
| 2018 | 5,263 | 0.9% |
| 2017 | 5,217 | 0.1% |
| 2016 | 5,211 | 0.7% |
| 2015 | 5,175 | 1.5% |
| 2014 | 5,097 | 0.9% |
| 2013 | 5,051 | 1.3% |
| 2012 | 4,988 | 0.5% |
| 2011 | 4,961 | - |
Race / Ethnicity in Manitou Springs
| Race | Manitou Springs | CO | USA |
|---|---|---|---|
| White | 89.2% | 67.5% | 60.1% |
| African American | 0.8% | 3.9% | 12.2% |
| American Indian | 0.6% | 0.5% | 0.6% |
| Asian | 2.6% | 3.1% | 5.6% |
| Hawaiian | 0.0% | 0.1% | 0.2% |
| Other | 0.0% | 0.2% | 0.3% |
| Two Or More | 1.5% | 2.9% | 2.8% |
| Hispanic | 5.4% | 21.7% | 18.2% |
Gender in Manitou Springs
| Gender | Manitou Springs | CO | USA |
|---|---|---|---|
| Female | 42.5% | 49.7% | 50.8% |
| Male | 57.5% | 50.3% | 49.2% |
Highest level of educational attainment in Manitou Springs for adults over 25
| Education | Manitou Springs | CO | USA |
|---|---|---|---|
| < 9th Grade | 0.0% | 3.0% | 5.0% |
| 9-12th Grade | 1.0% | 5.0% | 7.0% |
| High School / GED | 17.0% | 21.0% | 27.0% |
| Some College | 21.0% | 21.0% | 20.0% |
| Associate's Degree | 8.0% | 9.0% | 9.0% |
| Bachelor's Degree | 23.0% | 26.0% | 20.0% |
| Master's Degree | 21.0% | 11.0% | 9.0% |
| Professional Degree | 3.0% | 2.0% | 2.0% |
| Doctorate Degree | 6.0% | 2.0% | 1.0% |
Household Income For Manitou Springs, Colorado
| Income | Manitou Springs | CO | USA |
|---|---|---|---|
| Less than $10,000 | 4.9% | 4.5% | 5.8% |
| $10,000 to $14,999 | 8.8% | 3.1% | 4.1% |
| $15,000 to $24,999 | 8.6% | 6.6% | 8.5% |
| $25,000 to $34,999 | 8.6% | 7.2% | 8.6% |
| $35,000 to $49,999 | 10.2% | 11.0% | 12.0% |
| $50,000 to $74,999 | 11.7% | 17.4% | 17.2% |
| $75,000 to $99,999 | 13.1% | 13.6% | 12.8% |
| $100,000 to $149,999 | 12.5% | 18.2% | 15.6% |
| $150,000 to $199,999 | 13.9% | 8.7% | 7.1% |
| $200,000 or more | 7.6% | 9.6% | 8.3% |


