Vail, CO
Quality of Life, Demographics, And Statistics
HomeSnacks is reader-supported. When you click through real estate links on our site, we earn an affiliate commission. Learn more.
Vail, Colorado Info Snack
Table Of Contents
Population
5,614
Unemployment
7.7%
Poverty
8.7%
Median Home
$793,600
Median Income
$82,661
Median Rent
$1,506
Vail SnackAbility
7
Overall SnackAbility
Overall SnackAbility
Jobs
7/10
Housing
9.5
Affordability
4
Diversity
5
Safety
4
Amenities
8
Education
10
Commute
9
Vail, CO Crime Report
219
Total Crimes
Total Crimes
4,018.3
Total Crimes / 100k People
Total Crimes / 100k People
71.28%
Above National Average
Above National Average
| Statistic | Count Raw |
Vail / 100k People |
Colorado / 100k People |
National / 100k People |
|---|---|---|---|---|
| Total Crimes Per 100K | 219 | 4,018.3 | 3,256.9 | 2,346.0 |
| Violent Crime | 22 | 403.7 | 423.1 | 387.8 |
| Murder | 0 | 0.0 | 5.1 | 6.5 |
| Robbery | 0 | 0.0 | 68.3 | 73.9 |
| Aggravated Assault | 18 | 330.3 | 286.9 | 279.7 |
| Property Crime | 197 | 3,614.7 | 2,833.8 | 1,958.2 |
| Burglary | 23 | 422.0 | 400.3 | 314.2 |
| Larceny | 163 | 2,990.8 | 1,909.3 | 1,398.0 |
| Car Theft | 11 | 201.8 | 524.3 | 246.0 |
Vail, CO Cost Of Living
150
Vail's Overall Cost Of Living
Vail's Overall Cost Of Living
1.5x
Higher Than The National Average
Higher Than The National Average
| Living Expense | Vail | Colorado | National Average | |
|---|---|---|---|---|
| Overall | 150 | 112 | 100 | |
| Services | 108 | 104 | 100 | |
| Groceries | 104 | 103 | 100 | |
| Health | 112 | 103 | 100 | |
| Housing | 256 | 133 | 100 | |
| Transportation | 104 | 108 | 100 | |
| Utilities | 82 | 87 | 100 | |
Vail, CO Photos
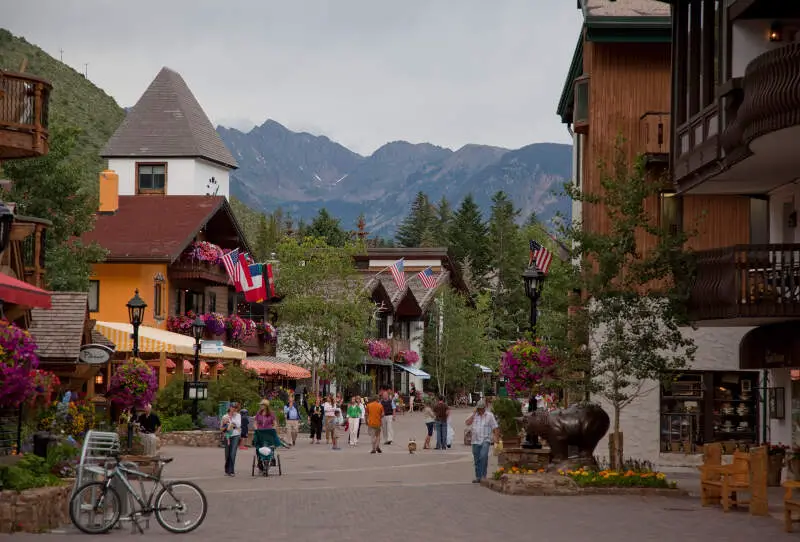
Source: Wikipedia User Nick Csakany | GFDL

Source: Wikipedia User Odbake | CC BY-SA 3.0

Source: Wikipedia User No machine-readable autho | GFDL

Source: Public Domain
Rankings for Vail in Colorado


Map Of Vail, CO
Best Places Around Vail
1
Central, LA
Population 29,235
2
Carbondale, CO
Population 6,658
3
Edwards, CO
Population 9,347
4
Avon, CO
Population 6,711
5
Aspen, CO
Population 7,721
6
Eagle, CO
Population 6,896
7
Gypsum, CO
Population 7,049
8
Georgetown, CT
Population 1,251
Population over time in Vail
| Year | Population | % Change |
|---|---|---|
| 2020 | 5,614 | 2.7% |
| 2019 | 5,469 | 0.8% |
| 2018 | 5,425 | 1.2% |
| 2017 | 5,363 | 0.8% |
| 2016 | 5,321 | 0.8% |
| 2015 | 5,280 | -0.5% |
| 2014 | 5,304 | 0.3% |
| 2013 | 5,287 | 0.1% |
| 2012 | 5,280 | 0.7% |
| 2011 | 5,241 | - |
Race / Ethnicity in Vail
| Race | Vail | CO | USA |
|---|---|---|---|
| White | 92.5% | 67.5% | 60.1% |
| African American | 0.1% | 3.9% | 12.2% |
| American Indian | 0.0% | 0.5% | 0.6% |
| Asian | 1.2% | 3.1% | 5.6% |
| Hawaiian | 0.0% | 0.1% | 0.2% |
| Other | 0.0% | 0.2% | 0.3% |
| Two Or More | 0.6% | 2.9% | 2.8% |
| Hispanic | 5.7% | 21.7% | 18.2% |
Gender in Vail
| Gender | Vail | CO | USA |
|---|---|---|---|
| Female | 47.4% | 49.7% | 50.8% |
| Male | 52.6% | 50.3% | 49.2% |
Highest level of educational attainment in Vail for adults over 25
| Education | Vail | CO | USA |
|---|---|---|---|
| < 9th Grade | 0.0% | 3.0% | 5.0% |
| 9-12th Grade | 1.0% | 5.0% | 7.0% |
| High School / GED | 6.0% | 21.0% | 27.0% |
| Some College | 20.0% | 21.0% | 20.0% |
| Associate's Degree | 8.0% | 9.0% | 9.0% |
| Bachelor's Degree | 42.0% | 26.0% | 20.0% |
| Master's Degree | 16.0% | 11.0% | 9.0% |
| Professional Degree | 6.0% | 2.0% | 2.0% |
| Doctorate Degree | 1.0% | 2.0% | 1.0% |
Household Income For Vail, Colorado
| Income | Vail | CO | USA |
|---|---|---|---|
| Less than $10,000 | 4.0% | 4.5% | 5.8% |
| $10,000 to $14,999 | 1.1% | 3.1% | 4.1% |
| $15,000 to $24,999 | 4.3% | 6.6% | 8.5% |
| $25,000 to $34,999 | 11.3% | 7.2% | 8.6% |
| $35,000 to $49,999 | 12.6% | 11.0% | 12.0% |
| $50,000 to $74,999 | 12.9% | 17.4% | 17.2% |
| $75,000 to $99,999 | 9.5% | 13.6% | 12.8% |
| $100,000 to $149,999 | 17.2% | 18.2% | 15.6% |
| $150,000 to $199,999 | 6.3% | 8.7% | 7.1% |
| $200,000 or more | 20.9% | 9.6% | 8.3% |


