Darien, CT
Quality of Life, Demographics, And Statistics
HomeSnacks is reader-supported. When you click through real estate links on our site, we earn an affiliate commission. Learn more.
Darien, Connecticut Info Snack
Table Of Contents
Population
21,742
Unemployment
4.9%
Poverty
4.0%
Median Home
$1,471,700
Median Income
$232,523
Median Rent
$2,469
Darien SnackAbility
6
Overall SnackAbility
Overall SnackAbility
Jobs
8.5/10
Housing
10
Affordability
7
Diversity
6
Safety
8.5
Amenities
8.5
Education
10
Commute
3
Darien, CT Crime Report
270
Total Crimes
Total Crimes
1,234.0
Total Crimes / 100k People
Total Crimes / 100k People
-50.18%
Below National Average
Below National Average
| Statistic | Count Raw |
Darien / 100k People |
Connecticut / 100k People |
National / 100k People |
|---|---|---|---|---|
| Total Crimes Per 100K | 270 | 1,234.0 | 1,610.2 | 2,476.7 |
| Violent Crime | 3 | 13.7 | 183.6 | 366.7 |
| Murder | 0 | 0.0 | 2.9 | 5.0 |
| Robbery | 1 | 4.6 | 54.1 | 81.6 |
| Aggravated Assault | 2 | 9.1 | 105.0 | 250.2 |
| Property Crime | 267 | 1,220.3 | 1,426.6 | 2,109.9 |
| Burglary | 29 | 132.5 | 180.7 | 340.5 |
| Larceny | 206 | 941.5 | 1,078.7 | 1,549.5 |
| Car Theft | 32 | 146.3 | 167.3 | 219.9 |
Darien, CT Cost Of Living
253
Darien's Overall Cost Of Living
Darien's Overall Cost Of Living
2.5x
Higher Than The National Average
Higher Than The National Average
| Living Expense | Darien | Connecticut | National Average | |
|---|---|---|---|---|
| Overall | 253 | 124 | 100 | |
| Services | 123 | 123 | 100 | |
| Groceries | 110 | 108 | 100 | |
| Health | 117 | 112 | 100 | |
| Housing | 562 | 137 | 100 | |
| Transportation | 124 | 114 | 100 | |
| Utilities | 123 | 129 | 100 | |
Darien, CT Photos
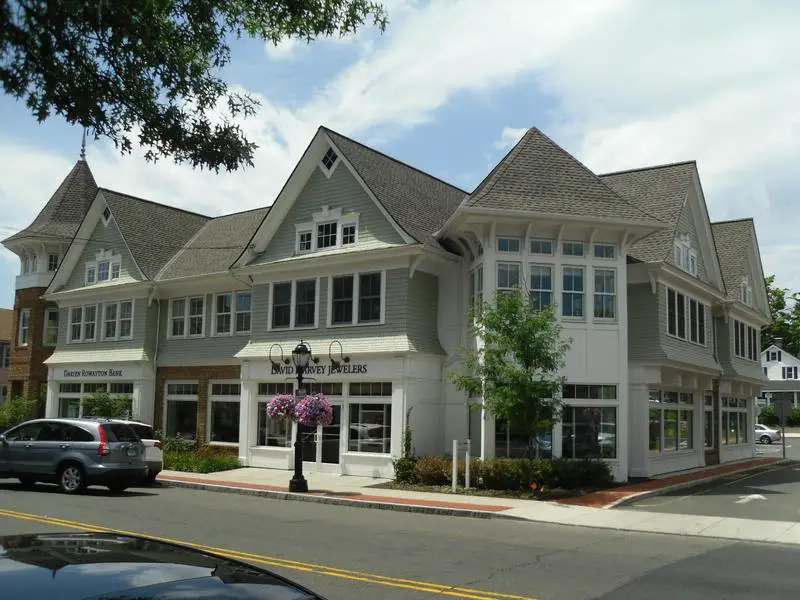
Source: Wikipedia User Doug Kerr | CC BY-SA 2.0
Rankings for Darien in Connecticut


Map Of Darien, CT
Best Places Around Darien
1
Plainview, NY
Population 26,453
2
Syosset, NY
Population 19,453
3
Bronxville, NY
Population 6,409
4
Jericho, NY
Population 13,889
5
East Hills, NY
Population 7,147
6
Pleasantville, NY
Population 7,221
7
Larchmont, NY
Population 6,096
8
Port Washington, NY
Population 15,808
9
Mamaroneck, NY
Population 19,217
10
Huntington, NY
Population 17,420
Population over time in Darien
| Year | Population | % Change |
|---|---|---|
| 2019 | 21,742 | -0.1% |
| 2018 | 21,759 | 0.1% |
| 2017 | 21,742 | 1.0% |
| 2016 | 21,519 | 0.6% |
| 2015 | 21,392 | 1.0% |
| 2014 | 21,190 | 1.3% |
| 2013 | 20,925 | 0.8% |
| 2012 | 20,758 | 0.9% |
| 2011 | 20,580 | 0.8% |
| 2010 | 20,414 | - |
Race / Ethnicity in Darien
| Race | Darien | CT | USA |
|---|---|---|---|
| White | 87.7% | 66.9% | 60.7% |
| African American | 0.8% | 9.9% | 12.3% |
| American Indian | 0.0% | 0.2% | 0.7% |
| Asian | 5.5% | 4.5% | 5.5% |
| Hawaiian | 0.0% | 0.0% | 0.2% |
| Other | 0.1% | 0.3% | 0.2% |
| Two Or More | 1.9% | 2.1% | 2.4% |
| Hispanic | 4.1% | 16.1% | 18.0% |
Gender in Darien
| Gender | Darien | CT | USA |
|---|---|---|---|
| Female | 50.6% | 51.2% | 50.8% |
| Male | 49.4% | 48.8% | 49.2% |
Highest level of educational attainment in Darien for adults over 25
| Education | Darien | CT | USA |
|---|---|---|---|
| < 9th Grade | 1.0% | 3.0% | 6.0% |
| 9-12th Grade | 1.0% | 5.0% | 7.0% |
| High School / GED | 6.0% | 27.0% | 27.0% |
| Some College | 6.0% | 17.0% | 20.0% |
| Associate's Degree | 3.0% | 8.0% | 8.0% |
| Bachelor's Degree | 48.0% | 22.0% | 20.0% |
| Master's Degree | 26.0% | 13.0% | 9.0% |
| Professional Degree | 7.0% | 3.0% | 2.0% |
| Doctorate Degree | 2.0% | 2.0% | 1.0% |
Household Income For Darien, Connecticut
| Income | Darien | CT | USA |
|---|---|---|---|
| Less than $10,000 | 2.1% | 5.0% | 6.0% |
| $10,000 to $14,999 | 1.6% | 3.5% | 4.3% |
| $15,000 to $24,999 | 2.1% | 7.1% | 8.9% |
| $25,000 to $34,999 | 2.6% | 6.9% | 8.9% |
| $35,000 to $49,999 | 3.4% | 10.4% | 12.3% |
| $50,000 to $74,999 | 6.3% | 15.1% | 17.2% |
| $75,000 to $99,999 | 4.9% | 12.5% | 12.7% |
| $100,000 to $149,999 | 12.4% | 17.3% | 15.1% |
| $150,000 to $199,999 | 9.6% | 9.5% | 6.8% |
| $200,000 or more | 55.1% | 12.6% | 7.7% |


