Deerfield Beach, FL
Quality of Life, Demographics, And Statistics
Living In Deerfield Beach, Florida Summary
Life in Deerfield Beach research summary. HomeSnacks has been researching the quality of life in Deerfield Beach over the past eight years using Census data, FBI crime data, cost of living data, and other primary sources. Based on the most recently available data, we found the following about life in Deerfield Beach:
The population in Deerfield Beach is 86,062.
The median home value in Deerfield Beach is $204,700.
The median income in Deerfield Beach is $49,650.
The cost of living in Deerfield Beach is 97 which is 1.0x lower than the national average.
The median rent in Deerfield Beach is $1,411.
The unemployment rate in Deerfield Beach is 6.6%.
The poverty rate in Deerfield Beach is 15.6%.
Table Of Contents
Deerfield Beach SnackAbility
6
Overall SnackAbility
Overall SnackAbility
Jobs
5/10
Housing
8.5
Affordability
4
Diversity
10
Safety
5
Amenities
10
Education
6
Commute
6
Deerfield Beach, FL Crime Report
1,888
Total Crimes
Total Crimes
2,309.5
Total Crimes / 100k People
Total Crimes / 100k People
-0.63%
Below National Average
Below National Average
| Statistic | Count Raw |
Deerfield Beach / 100k People |
Florida / 100k People |
National / 100k People |
|---|---|---|---|---|
| Total Crimes Per 100K | 1,888 | 2,309.5 | 2,153.0 | 2,324.2 |
| Violent Crime | 285 | 348.6 | 383.6 | 369.8 |
| Murder | 3 | 3.7 | 5.9 | 6.3 |
| Robbery | 59 | 72.2 | 62.2 | 66.1 |
| Aggravated Assault | 203 | 248.3 | 280.1 | 268.2 |
| Property Crime | 1,603 | 1,960.9 | 1,769.4 | 1,954.4 |
| Burglary | 135 | 165.1 | 240.6 | 269.8 |
| Larceny | 1,273 | 1,557.2 | 1,352.7 | 1,401.9 |
| Car Theft | 195 | 238.5 | 176.1 | 282.7 |
Deerfield Beach, FL Cost Of Living
97
Deerfield Beach's Overall Cost Of Living
Deerfield Beach's Overall Cost Of Living
1.0x
Lower Than The National Average
Lower Than The National Average
| Living Expense | Deerfield Beach | Florida | National Average | |
|---|---|---|---|---|
| Overall | 97 | 101 | 100 | |
| Services | 98 | 98 | 100 | |
| Groceries | 118 | 101 | 100 | |
| Health | 105 | 96 | 100 | |
| Housing | 86 | 108 | 100 | |
| Transportation | 111 | 98 | 100 | |
| Utilities | 100 | 100 | 100 | |
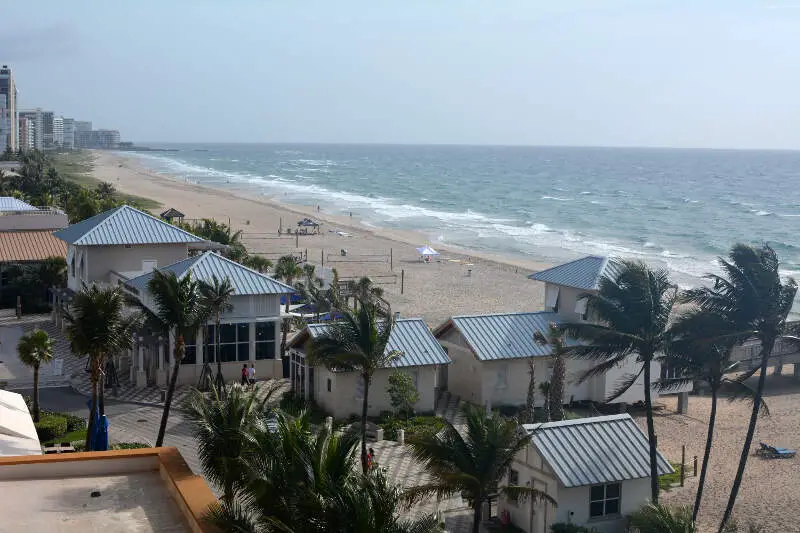
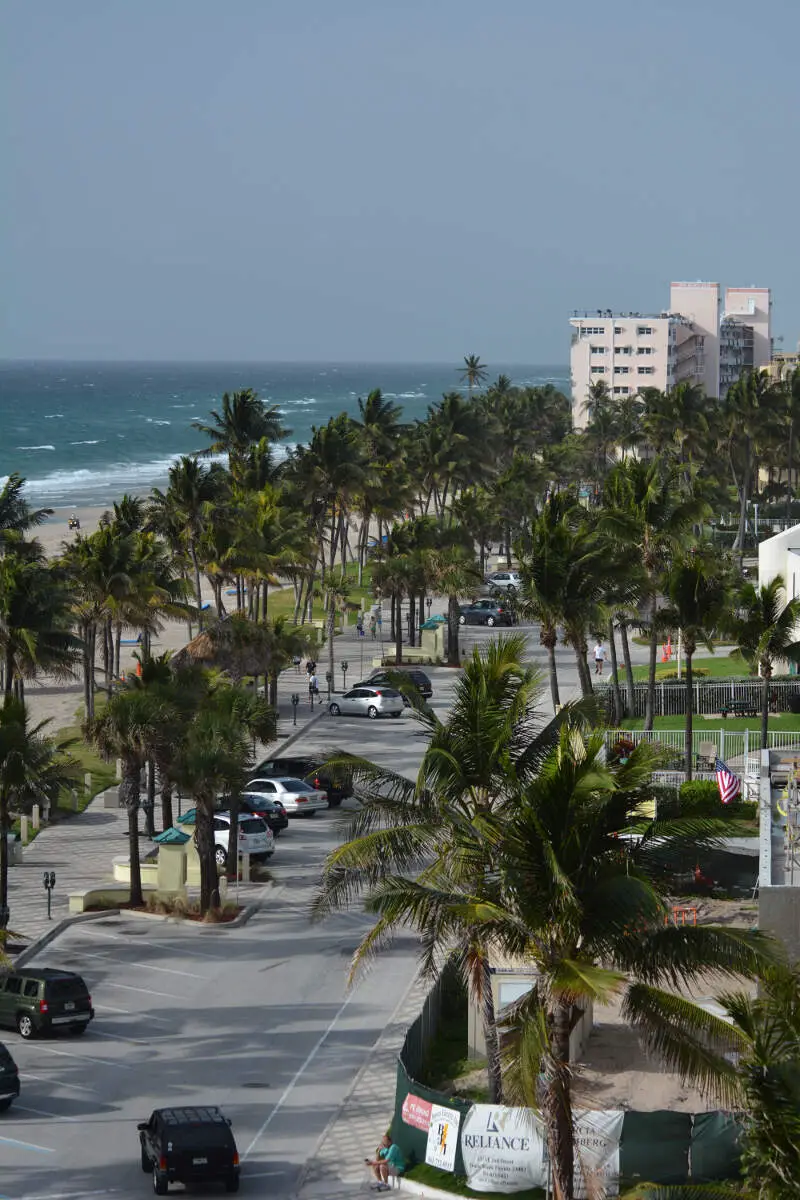
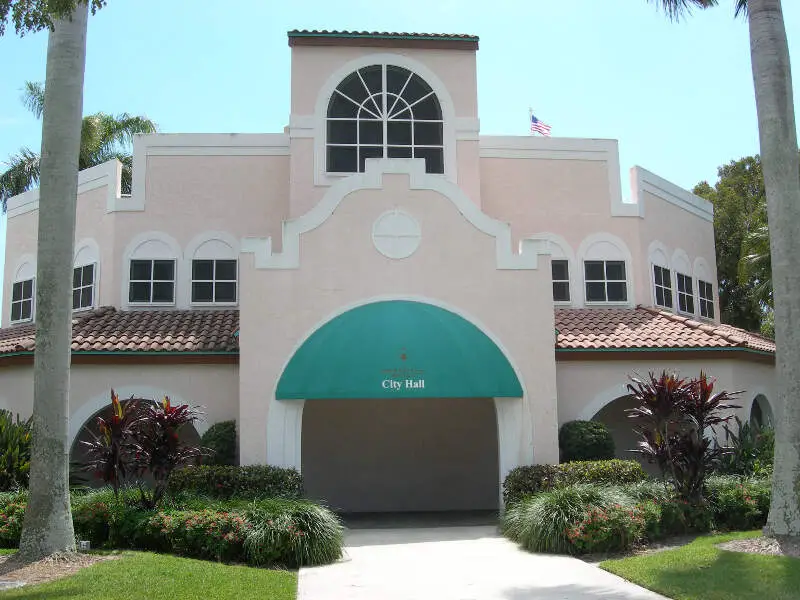
Deerfield Beach, FL Photos

Source: Wikipedia User | CC BY-SA 3.0
Source: Wikipedia User | CC BY-SA 3.0

Source: Wikipedia User | CC BY-SA 3.0
Source: Wikipedia User | CC BY-SA 3.0
Source: Wikipedia User Dtobias | GFDL

Source: Wikipedia User | CC BY-SA 3.0
Rankings for Deerfield Beach in Florida


Map Of Deerfield Beach, FL
Best Places Around Deerfield Beach
1
Coral Springs, FL
Population 133,693
2
Coconut Creek, FL
Population 57,553
3
Boca Raton, FL
Population 95,347
4
Parkland, FL
Population 33,772
5
Lighthouse Point, FL
Population 10,529
6
Davie, FL
Population 104,782
7
Oakland Park, FL
Population 44,092
8
North Lauderdale, FL
Population 44,579
9
Wilton Manors, FL
Population 11,525
10
Margate, FL
Population 58,331
Population over time in Deerfield Beach
| Year | Population | % Change |
|---|---|---|
| 2021 | 80,822 | 1.2% |
| 2020 | 79,854 | 0.5% |
| 2019 | 79,468 | 1.1% |
| 2018 | 78,642 | 0.5% |
| 2017 | 78,227 | 1.1% |
| 2016 | 77,341 | 1.3% |
| 2015 | 76,330 | 0.8% |
| 2014 | 75,724 | 0.6% |
| 2013 | 75,260 | -0.0% |
| 2012 | 75,276 | - |
Race / Ethnicity in Deerfield Beach
| Race | Deerfield Beach | FL | USA |
|---|---|---|---|
| White | 46.2% | 52.6% | 59.4% |
| African American | 25.4% | 15.1% | 12.2% |
| American Indian | 0.1% | 0.1% | 0.6% |
| Asian | 1.7% | 2.7% | 5.6% |
| Hawaiian | 0.0% | 0.1% | 0.2% |
| Other | 1.3% | 0.5% | 0.4% |
| Two Or More | 3.7% | 2.7% | 3.2% |
| Hispanic | 21.6% | 26.2% | 18.4% |
Gender in Deerfield Beach
| Gender | Deerfield Beach | FL | USA |
|---|---|---|---|
| Female | 54.4% | 50.8% | 50.5% |
| Male | 45.6% | 49.2% | 49.5% |
Highest level of educational attainment in Deerfield Beach for adults over 25
| Education | Deerfield Beach | FL | USA |
|---|---|---|---|
| < 9th Grade | 5.0% | 4.0% | 5.0% |
| 9-12th Grade | 8.0% | 7.0% | 6.0% |
| High School / GED | 29.0% | 28.0% | 26.0% |
| Some College | 21.0% | 20.0% | 20.0% |
| Associate's Degree | 9.0% | 10.0% | 9.0% |
| Bachelor's Degree | 18.0% | 20.0% | 21.0% |
| Master's Degree | 7.0% | 8.0% | 9.0% |
| Professional Degree | 2.0% | 2.0% | 2.0% |
| Doctorate Degree | 1.0% | 1.0% | 2.0% |
Household Income For Deerfield Beach, Florida
| Income | Deerfield Beach | FL | USA |
|---|---|---|---|
| Less than $10,000 | 8.6% | 5.9% | 5.5% |
| $10,000 to $14,999 | 5.6% | 3.9% | 3.9% |
| $15,000 to $24,999 | 10.1% | 8.6% | 7.8% |
| $25,000 to $34,999 | 11.8% | 9.3% | 8.2% |
| $35,000 to $49,999 | 14.1% | 13.0% | 11.4% |
| $50,000 to $74,999 | 20.9% | 18.2% | 16.8% |
| $75,000 to $99,999 | 9.8% | 12.8% | 12.8% |
| $100,000 to $149,999 | 11.0% | 14.7% | 16.3% |
| $150,000 to $199,999 | 3.7% | 6.3% | 7.8% |
| $200,000 or more | 4.3% | 7.3% | 9.5% |


