Fellsmere, FL
Quality of Life, Demographics, And Statistics
HomeSnacks is reader-supported. When you click through real estate links on our site, we earn an affiliate commission. Learn more.
Fellsmere, Florida Info Snack
Table Of Contents
Population
5,692
Unemployment
12.3%
Poverty
16.5%
Median Home
$107,100
Median Income
$37,143
Median Rent
$775
Fellsmere SnackAbility
3
Overall SnackAbility
Overall SnackAbility
Jobs
3/10
Housing
6
Affordability
6
Diversity
8.5
Safety
8
Amenities
6
Education
3
Commute
7
Fellsmere, FL Crime Report
60
Total Crimes
Total Crimes
1,042.2
Total Crimes / 100k People
Total Crimes / 100k People
-55.58%
Below National Average
Below National Average
| Statistic | Count Raw |
Fellsmere / 100k People |
Florida / 100k People |
National / 100k People |
|---|---|---|---|---|
| Total Crimes Per 100K | 60 | 1,042.2 | 2,153.0 | 2,346.0 |
| Violent Crime | 8 | 139.0 | 383.6 | 387.8 |
| Murder | 0 | 0.0 | 5.9 | 6.5 |
| Robbery | 1 | 17.4 | 62.2 | 73.9 |
| Aggravated Assault | 7 | 121.6 | 280.1 | 279.7 |
| Property Crime | 52 | 903.2 | 1,769.4 | 1,958.2 |
| Burglary | 8 | 139.0 | 240.6 | 314.2 |
| Larceny | 40 | 694.8 | 1,352.7 | 1,398.0 |
| Car Theft | 4 | 69.5 | 176.1 | 246.0 |
Fellsmere, FL Cost Of Living
90
Fellsmere's Overall Cost Of Living
Fellsmere's Overall Cost Of Living
0.9x
Lower Than The National Average
Lower Than The National Average
| Living Expense | Fellsmere | Florida | National Average | |
|---|---|---|---|---|
| Overall | 90 | 98 | 100 | |
| Services | 99 | 99 | 100 | |
| Groceries | 103 | 107 | 100 | |
| Health | 112 | 98 | 100 | |
| Housing | 52 | 96 | 100 | |
| Transportation | 102 | 102 | 100 | |
| Utilities | 115 | 106 | 100 | |
Fellsmere, FL Photos
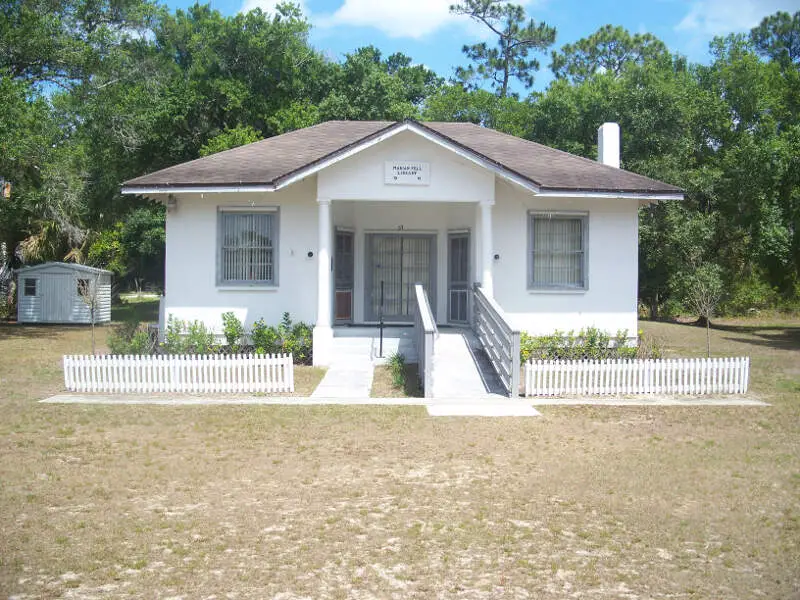
Source: Wikipedia User Ebyabe | GFDL
Rankings for Fellsmere in Florida


Map Of Fellsmere, FL
Best Places Around Fellsmere
1
Sebastian, FL
Population 25,613
2
Vero Beach South, FL
Population 28,676
3
Palm Bay, FL
Population 113,751
4
Florida Ridge, FL
Population 21,081
5
Vero Beach, FL
Population 17,163
Population over time in Fellsmere
| Year | Population | % Change |
|---|---|---|
| 2020 | 5,692 | 1.1% |
| 2019 | 5,629 | 1.1% |
| 2018 | 5,569 | 2.7% |
| 2017 | 5,424 | 0.6% |
| 2016 | 5,390 | 1.5% |
| 2015 | 5,312 | 1.5% |
| 2014 | 5,233 | 0.8% |
| 2013 | 5,194 | 1.3% |
| 2012 | 5,125 | 1.3% |
| 2011 | 5,059 | - |
Race / Ethnicity in Fellsmere
| Race | Fellsmere | FL | USA |
|---|---|---|---|
| White | 16.5% | 53.4% | 60.1% |
| African American | 13.2% | 15.2% | 12.2% |
| American Indian | 0.0% | 0.2% | 0.6% |
| Asian | 0.0% | 2.7% | 5.6% |
| Hawaiian | 0.0% | 0.1% | 0.2% |
| Other | 0.0% | 0.4% | 0.3% |
| Two Or More | 0.0% | 2.2% | 2.8% |
| Hispanic | 70.4% | 25.8% | 18.2% |
Gender in Fellsmere
| Gender | Fellsmere | FL | USA |
|---|---|---|---|
| Female | 47.8% | 51.1% | 50.8% |
| Male | 52.2% | 48.9% | 49.2% |
Highest level of educational attainment in Fellsmere for adults over 25
| Education | Fellsmere | FL | USA |
|---|---|---|---|
| < 9th Grade | 25.0% | 5.0% | 5.0% |
| 9-12th Grade | 18.0% | 7.0% | 7.0% |
| High School / GED | 27.0% | 28.0% | 27.0% |
| Some College | 11.0% | 20.0% | 20.0% |
| Associate's Degree | 6.0% | 10.0% | 9.0% |
| Bachelor's Degree | 11.0% | 19.0% | 20.0% |
| Master's Degree | 2.0% | 8.0% | 9.0% |
| Professional Degree | 0.0% | 2.0% | 2.0% |
| Doctorate Degree | 0.0% | 1.0% | 1.0% |
Household Income For Fellsmere, Florida
| Income | Fellsmere | FL | USA |
|---|---|---|---|
| Less than $10,000 | 1.7% | 6.2% | 5.8% |
| $10,000 to $14,999 | 2.2% | 4.2% | 4.1% |
| $15,000 to $24,999 | 23.1% | 9.3% | 8.5% |
| $25,000 to $34,999 | 22.6% | 9.9% | 8.6% |
| $35,000 to $49,999 | 16.4% | 13.8% | 12.0% |
| $50,000 to $74,999 | 13.1% | 18.3% | 17.2% |
| $75,000 to $99,999 | 5.2% | 12.5% | 12.8% |
| $100,000 to $149,999 | 10.8% | 13.7% | 15.6% |
| $150,000 to $199,999 | 5.0% | 5.6% | 7.1% |
| $200,000 or more | 0.0% | 6.4% | 8.3% |


