Ocala, FL
Demographics And Statistics
Living In Ocala, Florida Summary
Life in Ocala research summary. HomeSnacks has been using Saturday Night Science to research the quality of life in Ocala over the past nine years using Census, FBI, Zillow, and other primary data sources. Based on the most recently available data, we found the following about life in Ocala:
The population in Ocala is 63,504.
The median home value in Ocala is $270,146.
The median income in Ocala is $50,618.
The cost of living in Ocala is 85 which is 0.8x lower than the national average.
The median rent in Ocala is $1,166.
The unemployment rate in Ocala is 8.3%.
The poverty rate in Ocala is 18.0%.
The average high in Ocala is 81.8° and the average low is 58.5°.
Ocala SnackAbility
Overall SnackAbility
Ocala, FL Crime Report
Crime in Ocala summary. We use data from the FBI to determine the crime rates in Ocala. Key points include:
There were 2,349 total crimes in Ocala in the last reporting year.
The overall crime rate per 100,000 people in Ocala is 3,833.5 / 100k people.
The violent crime rate per 100,000 people in Ocala is 674.0 / 100k people.
The property crime rate per 100,000 people in Ocala is 3,159.5 / 100k people.
Overall, crime in Ocala is 64.94% above the national average.
Total Crimes
Above National Average
Crime In Ocala Comparison Table
| Statistic | Count Raw |
Ocala / 100k People |
Florida / 100k People |
National / 100k People |
|---|---|---|---|---|
| Total Crimes Per 100K | 2,349 | 3,833.5 | 2,153.0 | 2,324.2 |
| Violent Crime | 413 | 674.0 | 383.6 | 369.8 |
| Murder | 3 | 4.9 | 5.9 | 6.3 |
| Robbery | 61 | 99.6 | 62.2 | 66.1 |
| Aggravated Assault | 294 | 479.8 | 280.1 | 268.2 |
| Property Crime | 1,936 | 3,159.5 | 1,769.4 | 1,954.4 |
| Burglary | 161 | 262.7 | 240.6 | 269.8 |
| Larceny | 1,663 | 2,714.0 | 1,352.7 | 1,401.9 |
| Car Theft | 112 | 182.8 | 176.1 | 282.7 |
Ocala, FL Cost Of Living
Cost of living in Ocala summary. We use data on the cost of living to determine how expensive it is to live in Ocala. Real estate prices drive most of the variance in cost of living around Florida. Key points include:
The cost of living in Ocala is 85 with 100 being average.
The cost of living in Ocala is 0.8x lower than the national average.
The median home value in Ocala is $270,146.
The median income in Ocala is $50,618.
Ocala's Overall Cost Of Living
Lower Than The National Average
Cost Of Living In Ocala Comparison Table
| Living Expense | Ocala | Florida | National Average | |
|---|---|---|---|---|
| Overall | 85 | 101 | 100 | |
| Services | 93 | 98 | 100 | |
| Groceries | 98 | 101 | 100 | |
| Health | 97 | 96 | 100 | |
| Housing | 74 | 108 | 100 | |
| Transportation | 99 | 98 | 100 | |
| Utilities | 94 | 100 | 100 | |
Ocala, FL Weather
The average high in Ocala is 81.8° and the average low is 58.5°.
There are 76.3 days of precipitation each year.
Expect an average of 51.0 inches of precipitation each year with 0.0 inches of snow.
| Stat | Ocala |
|---|---|
| Average Annual High | 81.8 |
| Average Annual Low | 58.5 |
| Annual Precipitation Days | 76.3 |
| Average Annual Precipitation | 51.0 |
| Average Annual Snowfall | 0.0 |
Average High
Days of Rain
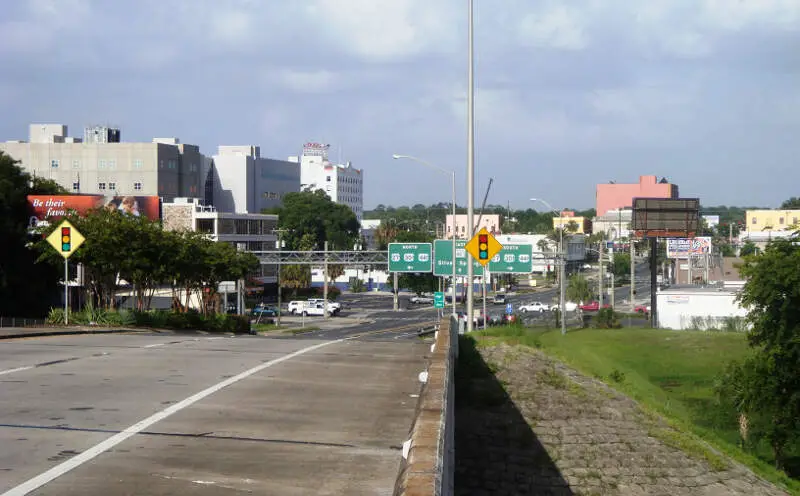
Ocala, FL Photos


Rankings for Ocala in Florida


Locations Around Ocala
Map Of Ocala, FL
Best Places Around Ocala
The Villages, FL
Population 79,108
Apopka, FL
Population 55,056
Gainesville, FL
Population 142,414
Tavares, FL
Population 19,088
Lady Lake, FL
Population 16,047
Clermont, FL
Population 43,266
Eustis, FL
Population 23,101
Leesburg, FL
Population 27,226
Homosassa Springs, FL
Population 15,365
Mount Dora, FL
Population 16,330
Ocala Demographics And Statistics
Population over time in Ocala
The current population in Ocala is 63,504. The population has increased 13.3% from 2010.
| Year | Population | % Change |
|---|---|---|
| 2022 | 63,504 | 8.4% |
| 2021 | 58,598 | 1.4% |
| 2020 | 57,812 | -0.1% |
| 2019 | 57,873 | 1.2% |
| 2018 | 57,209 | 0.5% |
| 2017 | 56,918 | 0.2% |
| 2016 | 56,828 | 0.4% |
| 2015 | 56,598 | 0.4% |
| 2014 | 56,376 | 0.6% |
| 2013 | 56,051 | - |
Race / Ethnicity in Ocala
Ocala is:
57.7% White with 36,636 White residents.
19.6% African American with 12,444 African American residents.
0.0% American Indian with 9 American Indian residents.
3.0% Asian with 1,903 Asian residents.
0.0% Hawaiian with 0 Hawaiian residents.
0.3% Other with 165 Other residents.
3.3% Two Or More with 2,071 Two Or More residents.
16.2% Hispanic with 10,276 Hispanic residents.
| Race | Ocala | FL | USA |
|---|---|---|---|
| White | 57.7% | 52.0% | 58.9% |
| African American | 19.6% | 14.9% | 12.1% |
| American Indian | 0.0% | 0.1% | 0.6% |
| Asian | 3.0% | 2.8% | 5.7% |
| Hawaiian | 0.0% | 0.1% | 0.2% |
| Other | 0.3% | 0.5% | 0.4% |
| Two Or More | 3.3% | 3.1% | 3.5% |
| Hispanic | 16.2% | 26.5% | 18.7% |
Gender in Ocala
Ocala is 51.8% female with 32,873 female residents.
Ocala is 48.2% male with 30,631 male residents.
| Gender | Ocala | FL | USA |
|---|---|---|---|
| Female | 51.8% | 50.8% | 50.4% |
| Male | 48.2% | 49.2% | 49.6% |
Highest level of educational attainment in Ocala for adults over 25
3.0% of adults in Ocala completed < 9th grade.
6.0% of adults in Ocala completed 9-12th grade.
30.0% of adults in Ocala completed high school / ged.
24.0% of adults in Ocala completed some college.
10.0% of adults in Ocala completed associate's degree.
17.0% of adults in Ocala completed bachelor's degree.
7.0% of adults in Ocala completed master's degree.
2.0% of adults in Ocala completed professional degree.
1.0% of adults in Ocala completed doctorate degree.
| Education | Ocala | FL | USA |
|---|---|---|---|
| < 9th Grade | 3.0% | 6.0% | 4.0% |
| 9-12th Grade | 6.0% | 6.0% | 6.0% |
| High School / GED | 30.0% | 28.0% | 26.0% |
| Some College | 24.0% | 19.0% | 20.0% |
| Associate's Degree | 10.0% | 10.0% | 9.0% |
| Bachelor's Degree | 17.0% | 20.0% | 21.0% |
| Master's Degree | 7.0% | 8.0% | 10.0% |
| Professional Degree | 2.0% | 2.0% | 2.0% |
| Doctorate Degree | 1.0% | 1.0% | 2.0% |
Household Income For Ocala, Florida
7.0% of households in Ocala earn Less than $10,000.
5.5% of households in Ocala earn $10,000 to $14,999.
10.2% of households in Ocala earn $15,000 to $24,999.
11.7% of households in Ocala earn $25,000 to $34,999.
15.0% of households in Ocala earn $35,000 to $49,999.
17.2% of households in Ocala earn $50,000 to $74,999.
10.7% of households in Ocala earn $75,000 to $99,999.
12.6% of households in Ocala earn $100,000 to $149,999.
3.9% of households in Ocala earn $150,000 to $199,999.
6.2% of households in Ocala earn $200,000 or more.
| Income | Ocala | FL | USA |
|---|---|---|---|
| Less than $10,000 | 7.0% | 5.2% | 4.9% |
| $10,000 to $14,999 | 5.5% | 3.7% | 3.8% |
| $15,000 to $24,999 | 10.2% | 7.6% | 7.0% |
| $25,000 to $34,999 | 11.7% | 8.3% | 7.4% |
| $35,000 to $49,999 | 15.0% | 12.1% | 10.7% |
| $50,000 to $74,999 | 17.2% | 17.6% | 16.1% |
| $75,000 to $99,999 | 10.7% | 13.2% | 12.8% |
| $100,000 to $149,999 | 12.6% | 16.0% | 17.1% |
| $150,000 to $199,999 | 3.9% | 7.4% | 8.8% |
| $200,000 or more | 6.2% | 9.0% | 11.4% |


