Tampa, FL
Quality of Life, Demographics, And Statistics
Living In Tampa, Florida Summary
Life in Tampa research summary. HomeSnacks has been researching the quality of life in Tampa over the past eight years using Census data, FBI crime data, cost of living data, and other primary sources. Based on the most recently available data, we found the following about life in Tampa:
The population in Tampa is 380,476.
The median home value in Tampa is $277,700.
The median income in Tampa is $59,893.
The cost of living in Tampa is 99 which is 1.0x lower than the national average.
The median rent in Tampa is $1,249.
The unemployment rate in Tampa is 5.5%.
The poverty rate in Tampa is 17.2%.
Table Of Contents
Tampa SnackAbility
6
Overall SnackAbility
Overall SnackAbility
Jobs
6/10
Housing
8.5
Affordability
4
Diversity
10
Safety
6
Amenities
9.5
Education
8
Commute
7
Tampa, FL Crime Report
8,468
Total Crimes
Total Crimes
2,170.5
Total Crimes / 100k People
Total Crimes / 100k People
-6.61%
Below National Average
Below National Average
| Statistic | Count Raw |
Tampa / 100k People |
Florida / 100k People |
National / 100k People |
|---|---|---|---|---|
| Total Crimes Per 100K | 8,468 | 2,170.5 | 2,153.0 | 2,324.2 |
| Violent Crime | 1,938 | 496.7 | 383.6 | 369.8 |
| Murder | 43 | 11.0 | 5.9 | 6.3 |
| Robbery | 315 | 80.7 | 62.2 | 66.1 |
| Aggravated Assault | 1,447 | 370.9 | 280.1 | 268.2 |
| Property Crime | 6,530 | 1,673.7 | 1,769.4 | 1,954.4 |
| Burglary | 756 | 193.8 | 240.6 | 269.8 |
| Larceny | 5,064 | 1,298.0 | 1,352.7 | 1,401.9 |
| Car Theft | 710 | 182.0 | 176.1 | 282.7 |
Tampa, FL Cost Of Living
99
Tampa's Overall Cost Of Living
Tampa's Overall Cost Of Living
1.0x
Lower Than The National Average
Lower Than The National Average
| Living Expense | Tampa | Florida | National Average | |
|---|---|---|---|---|
| Overall | 99 | 101 | 100 | |
| Services | 97 | 98 | 100 | |
| Groceries | 105 | 101 | 100 | |
| Health | 97 | 96 | 100 | |
| Housing | 97 | 108 | 100 | |
| Transportation | 100 | 98 | 100 | |
| Utilities | 102 | 100 | 100 | |
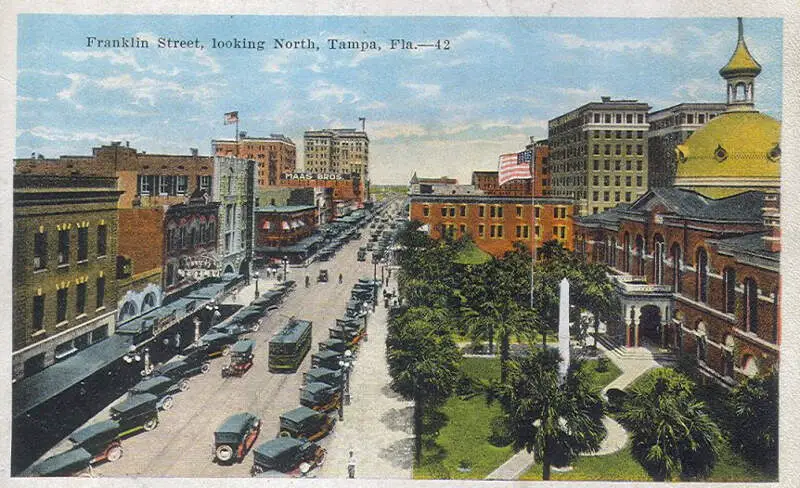
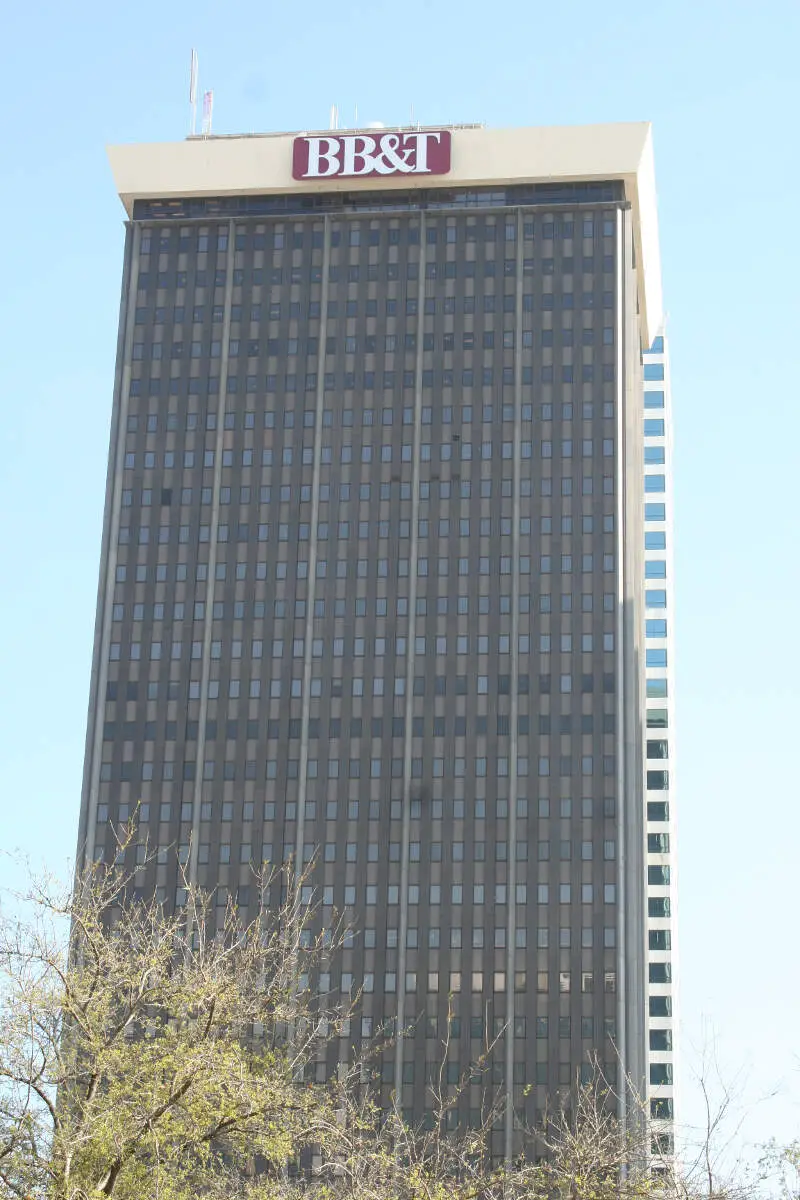
Tampa, FL Photos

Source: Public Domain
Source: Public Domain

Source: Public Domain

Source: Wikipedia User hyku | CC BY 2.0

Source: Wikipedia User Mwanner at en.wikipedia | GFDL

Source: Wikipedia User D'Arcy Norman | CC BY 2.0

Source: Wikipedia User Barbthebuilder | CC BY-SA 3.0

Source: Wikipedia User FightingRaven531 | CC BY 3.0
Source: Wikipedia User Barbthebuilder | CC BY-SA 3.0
Rankings for Tampa in Florida


Map Of Tampa, FL
Best Places Around Tampa
1
Safety Harbor, FL
Population 17,093
2
Carrollwood, FL
Population 35,846
3
Pinellas Park, FL
Population 53,130
4
Bloomingdale, FL
Population 25,042
5
Palm Harbor, FL
Population 60,682
6
Valrico, FL
Population 39,632
7
Northdale, FL
Population 24,924
8
Trinity, FL
Population 18,191
9
Citrus Park, FL
Population 27,440
10
Lutz, FL
Population 23,827
Population over time in Tampa
| Year | Population | % Change |
|---|---|---|
| 2021 | 395,912 | 5.2% |
| 2020 | 376,345 | 2.2% |
| 2019 | 368,087 | 1.8% |
| 2018 | 361,477 | 1.7% |
| 2017 | 355,603 | 1.9% |
| 2016 | 348,934 | 1.5% |
| 2015 | 343,768 | 1.3% |
| 2014 | 339,391 | 1.0% |
| 2013 | 336,171 | 0.9% |
| 2012 | 333,327 | - |
Race / Ethnicity in Tampa
| Race | Tampa | FL | USA |
|---|---|---|---|
| White | 44.4% | 52.6% | 59.4% |
| African American | 21.1% | 15.1% | 12.2% |
| American Indian | 0.1% | 0.1% | 0.6% |
| Asian | 4.5% | 2.7% | 5.6% |
| Hawaiian | 0.1% | 0.1% | 0.2% |
| Other | 0.3% | 0.5% | 0.4% |
| Two Or More | 3.3% | 2.7% | 3.2% |
| Hispanic | 26.2% | 26.2% | 18.4% |
Gender in Tampa
| Gender | Tampa | FL | USA |
|---|---|---|---|
| Female | 50.4% | 50.8% | 50.5% |
| Male | 49.6% | 49.2% | 49.5% |
Highest level of educational attainment in Tampa for adults over 25
| Education | Tampa | FL | USA |
|---|---|---|---|
| < 9th Grade | 5.0% | 4.0% | 5.0% |
| 9-12th Grade | 7.0% | 7.0% | 6.0% |
| High School / GED | 23.0% | 28.0% | 26.0% |
| Some College | 15.0% | 20.0% | 20.0% |
| Associate's Degree | 8.0% | 10.0% | 9.0% |
| Bachelor's Degree | 25.0% | 20.0% | 21.0% |
| Master's Degree | 11.0% | 8.0% | 9.0% |
| Professional Degree | 4.0% | 2.0% | 2.0% |
| Doctorate Degree | 2.0% | 1.0% | 2.0% |
Household Income For Tampa, Florida
| Income | Tampa | FL | USA |
|---|---|---|---|
| Less than $10,000 | 8.5% | 5.9% | 5.5% |
| $10,000 to $14,999 | 4.4% | 3.9% | 3.9% |
| $15,000 to $24,999 | 8.5% | 8.6% | 7.8% |
| $25,000 to $34,999 | 9.4% | 9.3% | 8.2% |
| $35,000 to $49,999 | 12.0% | 13.0% | 11.4% |
| $50,000 to $74,999 | 15.8% | 18.2% | 16.8% |
| $75,000 to $99,999 | 10.8% | 12.8% | 12.8% |
| $100,000 to $149,999 | 13.3% | 14.7% | 16.3% |
| $150,000 to $199,999 | 6.2% | 6.3% | 7.8% |
| $200,000 or more | 11.1% | 7.3% | 9.5% |


