Atlanta, GA
Quality of Life, Demographics, And Statistics
Living In Atlanta, Georgia Summary
Life in Atlanta research summary. HomeSnacks has been researching the quality of life in Atlanta over the past eight years using Census data, FBI crime data, cost of living data, and other primary sources. Based on the most recently available data, we found the following about life in Atlanta:
The population in Atlanta is 492,204.
The median home value in Atlanta is $346,600.
The median income in Atlanta is $69,164.
The cost of living in Atlanta is 107 which is 1.1x higher than the national average.
The median rent in Atlanta is $1,342.
The unemployment rate in Atlanta is 6.1%.
The poverty rate in Atlanta is 18.5%.
Table Of Contents
Atlanta SnackAbility
7
Overall SnackAbility
Overall SnackAbility
Jobs
7/10
Housing
8.5
Affordability
4
Diversity
9.5
Safety
N/A
Amenities
9.5
Education
8.5
Commute
6
Atlanta, GA Crime Report
22,746
Total Crimes
Total Crimes
4,588.6
Total Crimes / 100k People
Total Crimes / 100k People
97.43%
Above National Average
Above National Average
| Statistic | Count Raw |
Atlanta / 100k People |
Georgia / 100k People |
National / 100k People |
|---|---|---|---|---|
| Total Crimes Per 100K | 22,746 | 4,588.6 | 2,407.4 | 2,324.2 |
| Violent Crime | 4,167 | 840.6 | 400.1 | 369.8 |
| Murder | 168 | 33.9 | 8.8 | 6.3 |
| Robbery | 711 | 143.4 | 65.5 | 66.1 |
| Aggravated Assault | 3,131 | 631.6 | 293.8 | 268.2 |
| Property Crime | 18,579 | 3,748.0 | 2,007.4 | 1,954.4 |
| Burglary | 1,839 | 371.0 | 290.7 | 269.8 |
| Larceny | 13,437 | 2,710.7 | 1,478.5 | 1,401.9 |
| Car Theft | 3,303 | 666.3 | 238.2 | 282.7 |
Atlanta, GA Cost Of Living
107
Atlanta's Overall Cost Of Living
Atlanta's Overall Cost Of Living
1.1x
Higher Than The National Average
Higher Than The National Average
| Living Expense | Atlanta | Georgia | National Average | |
|---|---|---|---|---|
| Overall | 107 | 89 | 100 | |
| Services | 102 | 95 | 100 | |
| Groceries | 106 | 96 | 100 | |
| Health | 100 | 98 | 100 | |
| Housing | 116 | 76 | 100 | |
| Transportation | 104 | 90 | 100 | |
| Utilities | 85 | 86 | 100 | |
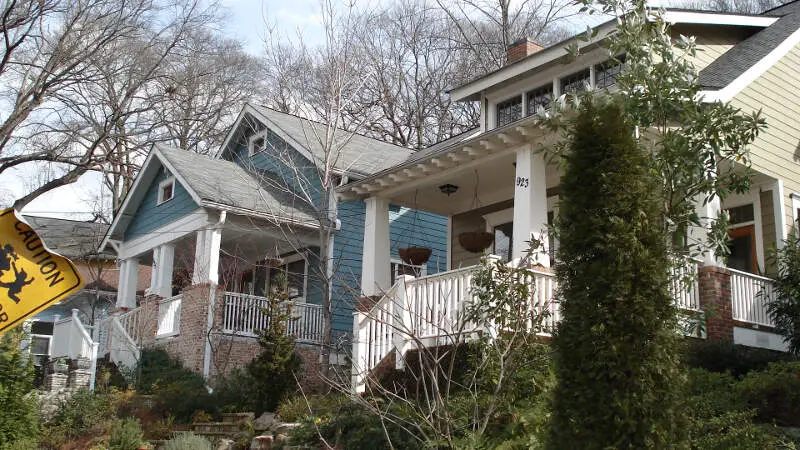
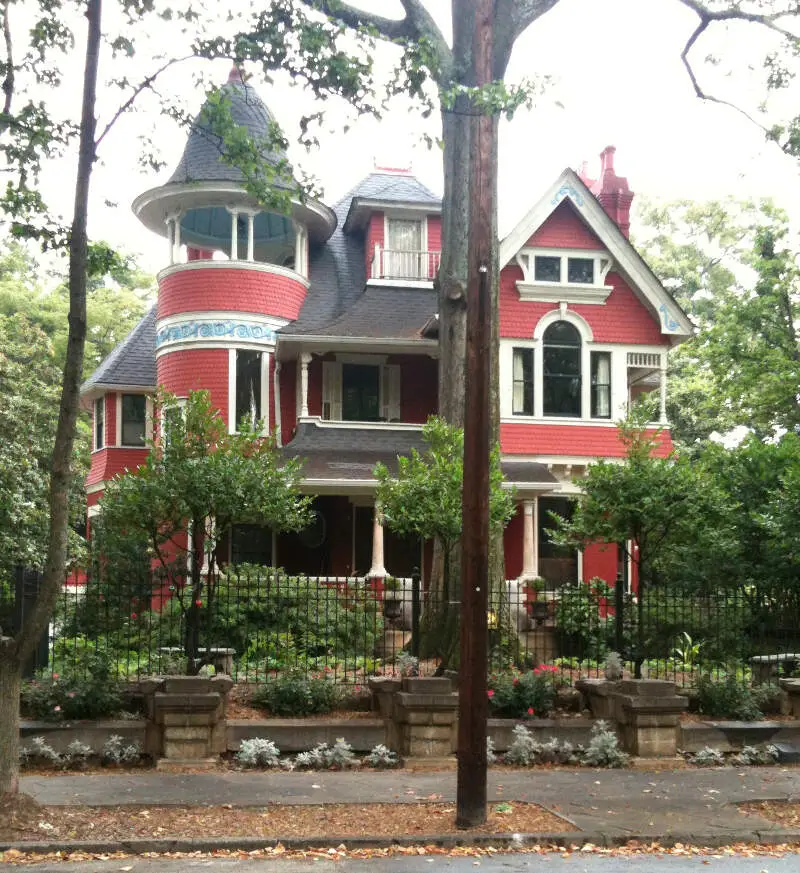
Atlanta, GA Photos

Source: Wikipedia User Isawooty | CC BY-SA 3.0

Source: Wikipedia User Taylor Davis | CC BY 2.0

Source: Wikipedia User Mike | CC BY 2.0
Source: Wikipedia User Original uploader was Atl | GFDL
Source: Wikipedia User Keizers | CC BY-SA 3.0

Source: Wikipedia User The original uploader was | GFDL

Source: Public Domain

Source: Wikipedia User Charles Atkeison | CC BY 2.0

Source: Wikipedia User John Ramspott | CC BY 2.0
Atlanta Articles


Rankings for Atlanta in Georgia
Map Of Atlanta, GA
Best Places Around Atlanta
1
Roswell, GA
Population 92,688
2
Mountain Park, GA
Population 12,680
3
Sandy Springs, GA
Population 106,605
4
Decatur, GA
Population 24,334
5
Druid Hills, GA
Population 8,611
6
Dunwoody, GA
Population 51,103
7
North Decatur, GA
Population 16,369
8
Mableton, GA
Population 41,632
9
Smyrna, GA
Population 55,460
Population over time in Atlanta
| Year | Population | % Change |
|---|---|---|
| 2021 | 497,642 | 3.7% |
| 2020 | 479,655 | 3.1% |
| 2019 | 465,230 | 1.9% |
| 2018 | 456,378 | 1.7% |
| 2017 | 448,901 | 1.9% |
| 2016 | 440,641 | 1.9% |
| 2015 | 432,589 | 1.6% |
| 2014 | 425,931 | 1.6% |
| 2013 | 419,250 | 1.4% |
| 2012 | 413,462 | - |
Race / Ethnicity in Atlanta
| Race | Atlanta | GA | USA |
|---|---|---|---|
| White | 39.1% | 51.4% | 59.4% |
| African American | 47.7% | 31.1% | 12.2% |
| American Indian | 0.2% | 0.1% | 0.6% |
| Asian | 5.0% | 4.2% | 5.6% |
| Hawaiian | 0.0% | 0.0% | 0.2% |
| Other | 0.4% | 0.4% | 0.4% |
| Two Or More | 2.6% | 2.8% | 3.2% |
| Hispanic | 5.0% | 9.9% | 18.4% |
Gender in Atlanta
| Gender | Atlanta | GA | USA |
|---|---|---|---|
| Female | 51.1% | 51.1% | 50.5% |
| Male | 48.9% | 48.9% | 49.5% |
Highest level of educational attainment in Atlanta for adults over 25
| Education | Atlanta | GA | USA |
|---|---|---|---|
| < 9th Grade | 1.0% | 6.0% | 5.0% |
| 9-12th Grade | 6.0% | 7.0% | 6.0% |
| High School / GED | 17.0% | 27.0% | 26.0% |
| Some College | 14.0% | 20.0% | 20.0% |
| Associate's Degree | 5.0% | 8.0% | 9.0% |
| Bachelor's Degree | 32.0% | 20.0% | 21.0% |
| Master's Degree | 16.0% | 9.0% | 9.0% |
| Professional Degree | 6.0% | 2.0% | 2.0% |
| Doctorate Degree | 3.0% | 1.0% | 2.0% |
Household Income For Atlanta, Georgia
| Income | Atlanta | GA | USA |
|---|---|---|---|
| Less than $10,000 | 8.8% | 6.1% | 5.5% |
| $10,000 to $14,999 | 5.4% | 4.0% | 3.9% |
| $15,000 to $24,999 | 8.1% | 8.3% | 7.8% |
| $25,000 to $34,999 | 7.3% | 8.8% | 8.2% |
| $35,000 to $49,999 | 9.4% | 11.9% | 11.4% |
| $50,000 to $74,999 | 14.5% | 17.4% | 16.8% |
| $75,000 to $99,999 | 11.0% | 12.9% | 12.8% |
| $100,000 to $149,999 | 13.5% | 15.5% | 16.3% |
| $150,000 to $199,999 | 7.4% | 7.1% | 7.8% |
| $200,000 or more | 14.6% | 8.1% | 9.5% |


