Lawrenceville, GA
Quality of Life, Demographics, And Statistics
Living In Lawrenceville, Georgia Summary
Life in Lawrenceville research summary. HomeSnacks has been researching the quality of life in Lawrenceville over the past eight years using Census data, FBI crime data, cost of living data, and other primary sources. Based on the most recently available data, we found the following about life in Lawrenceville:
The population in Lawrenceville is 30,299.
The median home value in Lawrenceville is $216,800.
The median income in Lawrenceville is $51,242.
The cost of living in Lawrenceville is 97 which is 1.0x lower than the national average.
The median rent in Lawrenceville is $1,185.
The unemployment rate in Lawrenceville is 6.8%.
The poverty rate in Lawrenceville is 17.5%.
Table Of Contents
Lawrenceville SnackAbility
6
Overall SnackAbility
Overall SnackAbility
Jobs
6/10
Housing
8
Affordability
5
Diversity
10
Safety
N/A
Amenities
9
Education
6
Commute
4
Lawrenceville, GA Cost Of Living
97
Lawrenceville's Overall Cost Of Living
Lawrenceville's Overall Cost Of Living
1.0x
Lower Than The National Average
Lower Than The National Average
| Living Expense | Lawrenceville | Georgia | National Average | |
|---|---|---|---|---|
| Overall | 97 | 89 | 100 | |
| Services | 104 | 95 | 100 | |
| Groceries | 107 | 96 | 100 | |
| Health | 101 | 98 | 100 | |
| Housing | 83 | 76 | 100 | |
| Transportation | 101 | 90 | 100 | |
| Utilities | 86 | 86 | 100 | |
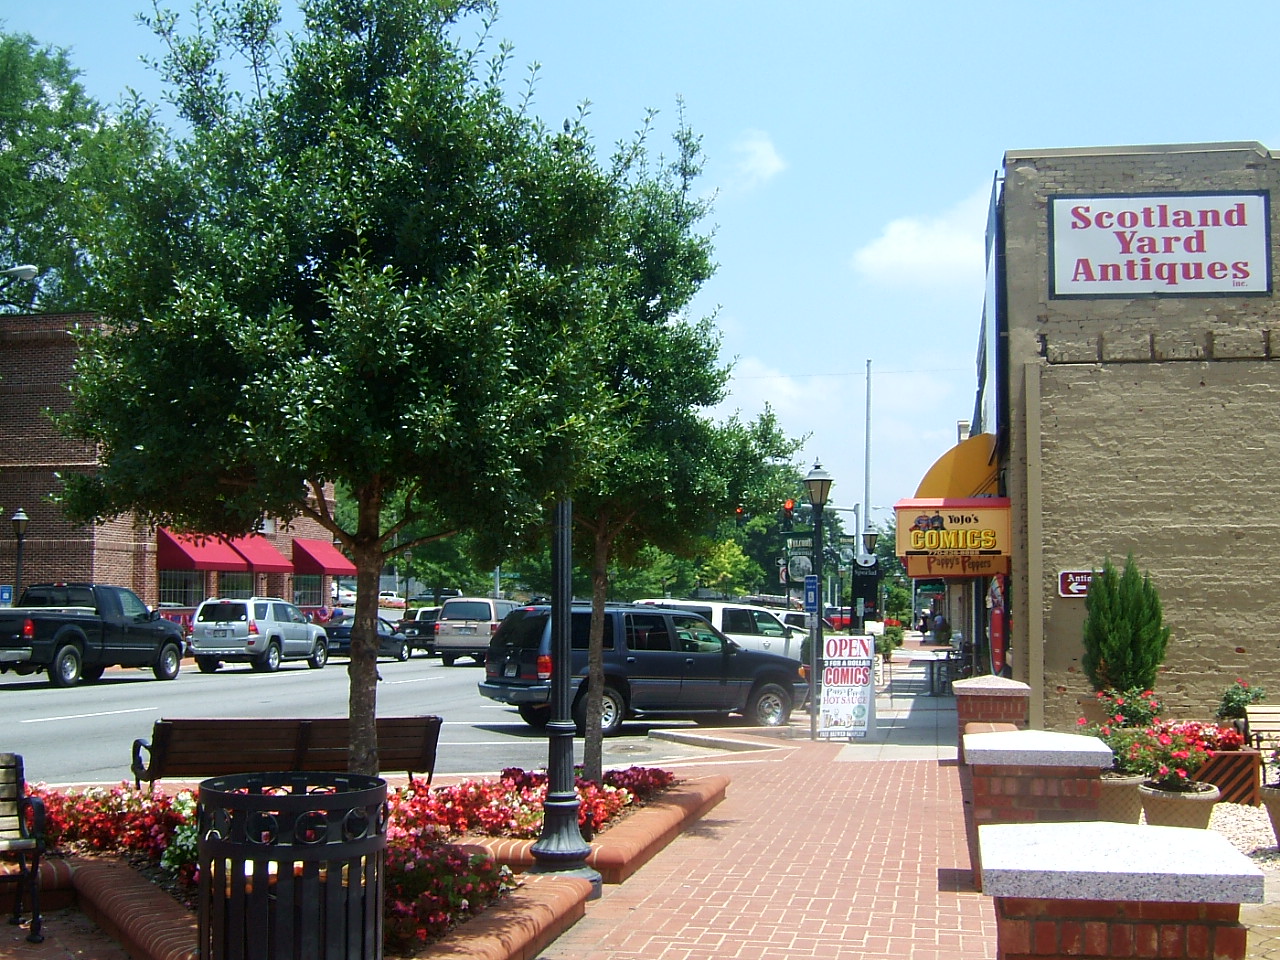
Lawrenceville, GA Photos

Source: Wikipedia User Open street map | CC BY 2.5
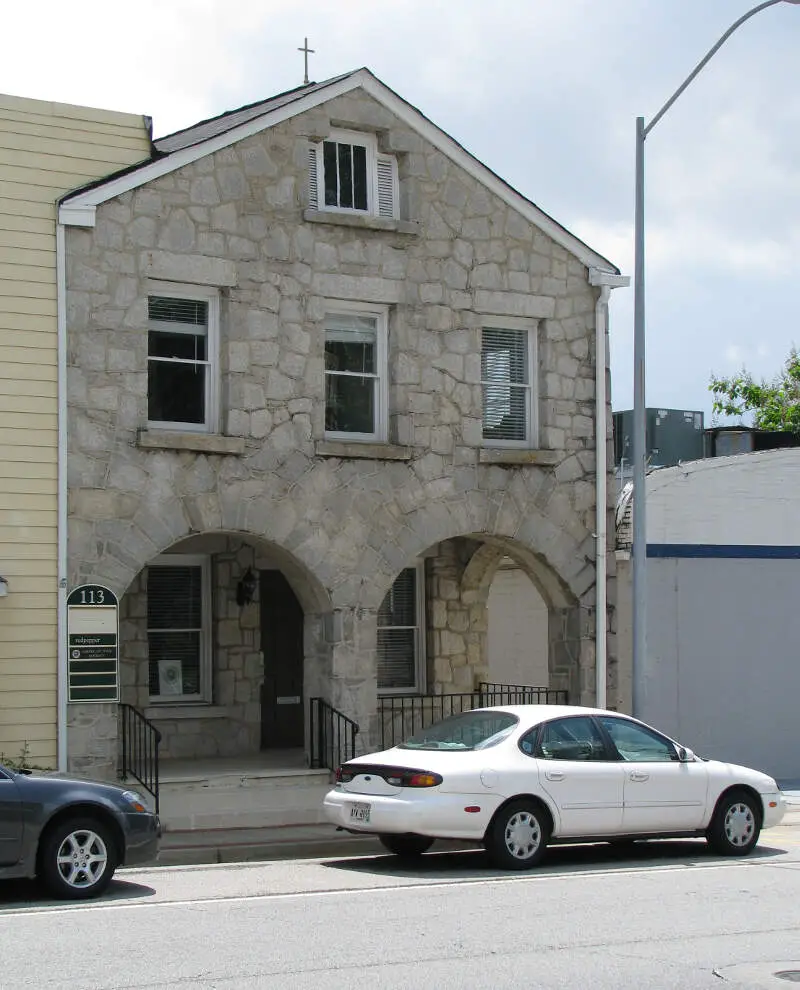
Source: Wikipedia User A Softer Answer | CC BY-SA 3.0

Source: Wikipedia

Source: Wikipedia User A Softer Answer | CC BY-SA 3.0

Source: Wikipedia User dbking | CC BY 2.0
Rankings for Lawrenceville in Georgia


Map Of Lawrenceville, GA
Best Places Around Lawrenceville
1
Alpharetta, GA
Population 65,187
2
Mountain Park, GA
Population 12,680
3
Johns Creek, GA
Population 82,068
4
Suwanee, GA
Population 20,629
5
Duluth, GA
Population 31,506
6
Sugar Hill, GA
Population 24,599
7
Dunwoody, GA
Population 51,103
8
North Decatur, GA
Population 16,369
9
Snellville, GA
Population 20,475
Population over time in Lawrenceville
| Year | Population | % Change |
|---|---|---|
| 2021 | 30,125 | 2.5% |
| 2020 | 29,401 | 0.4% |
| 2019 | 29,287 | -2.8% |
| 2018 | 30,127 | 1.3% |
| 2017 | 29,738 | 1.3% |
| 2016 | 29,364 | 1.3% |
| 2015 | 28,990 | 1.4% |
| 2014 | 28,595 | 1.3% |
| 2013 | 28,234 | 1.9% |
| 2012 | 27,704 | - |
Race / Ethnicity in Lawrenceville
| Race | Lawrenceville | GA | USA |
|---|---|---|---|
| White | 31.0% | 51.4% | 59.4% |
| African American | 33.4% | 31.1% | 12.2% |
| American Indian | 0.2% | 0.1% | 0.6% |
| Asian | 6.6% | 4.2% | 5.6% |
| Hawaiian | 0.0% | 0.0% | 0.2% |
| Other | 0.0% | 0.4% | 0.4% |
| Two Or More | 5.0% | 2.8% | 3.2% |
| Hispanic | 23.7% | 9.9% | 18.4% |
Gender in Lawrenceville
| Gender | Lawrenceville | GA | USA |
|---|---|---|---|
| Female | 52.9% | 51.1% | 50.5% |
| Male | 47.1% | 48.9% | 49.5% |
Highest level of educational attainment in Lawrenceville for adults over 25
| Education | Lawrenceville | GA | USA |
|---|---|---|---|
| < 9th Grade | 7.0% | 6.0% | 5.0% |
| 9-12th Grade | 8.0% | 7.0% | 6.0% |
| High School / GED | 28.0% | 27.0% | 26.0% |
| Some College | 21.0% | 20.0% | 20.0% |
| Associate's Degree | 10.0% | 8.0% | 9.0% |
| Bachelor's Degree | 18.0% | 20.0% | 21.0% |
| Master's Degree | 6.0% | 9.0% | 9.0% |
| Professional Degree | 1.0% | 2.0% | 2.0% |
| Doctorate Degree | 1.0% | 1.0% | 2.0% |
Household Income For Lawrenceville, Georgia
| Income | Lawrenceville | GA | USA |
|---|---|---|---|
| Less than $10,000 | 6.8% | 6.1% | 5.5% |
| $10,000 to $14,999 | 5.0% | 4.0% | 3.9% |
| $15,000 to $24,999 | 6.9% | 8.3% | 7.8% |
| $25,000 to $34,999 | 11.8% | 8.8% | 8.2% |
| $35,000 to $49,999 | 18.2% | 11.9% | 11.4% |
| $50,000 to $74,999 | 15.3% | 17.4% | 16.8% |
| $75,000 to $99,999 | 14.8% | 12.9% | 12.8% |
| $100,000 to $149,999 | 14.8% | 15.5% | 16.3% |
| $150,000 to $199,999 | 2.7% | 7.1% | 7.8% |
| $200,000 or more | 3.7% | 8.1% | 9.5% |


