Rome, GA
Quality of Life, Demographics, And Statistics
Living In Rome, Georgia Summary
Life in Rome research summary. HomeSnacks has been researching the quality of life in Rome over the past eight years using Census data, FBI crime data, cost of living data, and other primary sources. Based on the most recently available data, we found the following about life in Rome:
The population in Rome is 37,509.
The median home value in Rome is $164,500.
The median income in Rome is $40,000.
The cost of living in Rome is 90 which is 0.9x lower than the national average.
The median rent in Rome is $799.
The unemployment rate in Rome is 5.1%.
The poverty rate in Rome is 24.7%.
Table Of Contents
Rome SnackAbility
6
Overall SnackAbility
Overall SnackAbility
Jobs
5/10
Housing
6
Affordability
5
Diversity
9.5
Safety
N/A
Amenities
8.5
Education
6
Commute
8
Rome, GA Cost Of Living
90
Rome's Overall Cost Of Living
Rome's Overall Cost Of Living
0.9x
Lower Than The National Average
Lower Than The National Average
| Living Expense | Rome | Georgia | National Average | |
|---|---|---|---|---|
| Overall | 90 | 89 | 100 | |
| Services | 100 | 95 | 100 | |
| Groceries | 91 | 96 | 100 | |
| Health | 91 | 98 | 100 | |
| Housing | 67 | 76 | 100 | |
| Transportation | 91 | 90 | 100 | |
| Utilities | 98 | 86 | 100 | |
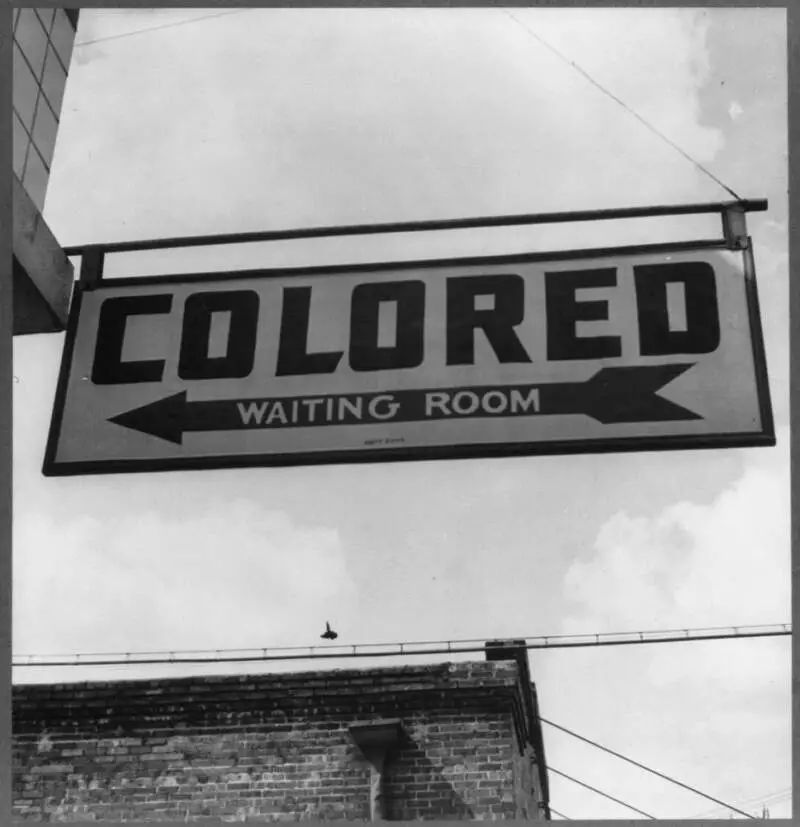
Rome, GA Photos

Source: Public Domain

Source: Public Domain
Source: Public Domain

Source: Public Domain

Source: Public Domain

Source: Wikipedia User William Fred Lambert, Pil | GFDL

Source: Public Domain

Source: Public Domain

Source: Public Domain
Rankings for Rome in Georgia


Map Of Rome, GA
Best Places Around Rome
1
Mountain Park, GA
Population 12,680
2
Woodstock, GA
Population 33,857
3
Acworth, GA
Population 22,330
4
Kennesaw, GA
Population 33,036
5
Holly Springs, GA
Population 15,784
6
Mableton, GA
Population 41,632
7
Smyrna, GA
Population 55,460
8
Powder Springs, GA
Population 16,698
9
Canton, GA
Population 32,342
10
Vinings, GA
Population 12,793
Population over time in Rome
| Year | Population | % Change |
|---|---|---|
| 2021 | 36,518 | 0.9% |
| 2020 | 36,185 | 0.4% |
| 2019 | 36,029 | -0.9% |
| 2018 | 36,340 | 0.2% |
| 2017 | 36,278 | 0.5% |
| 2016 | 36,099 | -0.3% |
| 2015 | 36,211 | -0.2% |
| 2014 | 36,277 | 0.1% |
| 2013 | 36,239 | -0.0% |
| 2012 | 36,257 | - |
Race / Ethnicity in Rome
| Race | Rome | GA | USA |
|---|---|---|---|
| White | 47.5% | 51.4% | 59.4% |
| African American | 24.9% | 31.1% | 12.2% |
| American Indian | 0.0% | 0.1% | 0.6% |
| Asian | 2.0% | 4.2% | 5.6% |
| Hawaiian | 0.0% | 0.0% | 0.2% |
| Other | 0.4% | 0.4% | 0.4% |
| Two Or More | 3.1% | 2.8% | 3.2% |
| Hispanic | 22.1% | 9.9% | 18.4% |
Gender in Rome
| Gender | Rome | GA | USA |
|---|---|---|---|
| Female | 54.0% | 51.1% | 50.5% |
| Male | 46.0% | 48.9% | 49.5% |
Highest level of educational attainment in Rome for adults over 25
| Education | Rome | GA | USA |
|---|---|---|---|
| < 9th Grade | 12.0% | 6.0% | 5.0% |
| 9-12th Grade | 10.0% | 7.0% | 6.0% |
| High School / GED | 26.0% | 27.0% | 26.0% |
| Some College | 19.0% | 20.0% | 20.0% |
| Associate's Degree | 8.0% | 8.0% | 9.0% |
| Bachelor's Degree | 13.0% | 20.0% | 21.0% |
| Master's Degree | 7.0% | 9.0% | 9.0% |
| Professional Degree | 3.0% | 2.0% | 2.0% |
| Doctorate Degree | 2.0% | 1.0% | 2.0% |
Household Income For Rome, Georgia
| Income | Rome | GA | USA |
|---|---|---|---|
| Less than $10,000 | 10.0% | 6.1% | 5.5% |
| $10,000 to $14,999 | 5.7% | 4.0% | 3.9% |
| $15,000 to $24,999 | 13.4% | 8.3% | 7.8% |
| $25,000 to $34,999 | 14.9% | 8.8% | 8.2% |
| $35,000 to $49,999 | 12.1% | 11.9% | 11.4% |
| $50,000 to $74,999 | 15.5% | 17.4% | 16.8% |
| $75,000 to $99,999 | 8.4% | 12.9% | 12.8% |
| $100,000 to $149,999 | 12.2% | 15.5% | 16.3% |
| $150,000 to $199,999 | 3.4% | 7.1% | 7.8% |
| $200,000 or more | 4.3% | 8.1% | 9.5% |


