Vinton, IA
Quality of Life, Demographics, And Statistics
HomeSnacks is reader-supported. When you click through real estate links on our site, we earn an affiliate commission. Learn more.
Vinton, Iowa Info Snack
Table Of Contents
Population
5,075
Unemployment
1.4%
Poverty
14.7%
Median Home
$130,100
Median Income
$44,053
Median Rent
$826
Vinton SnackAbility
5
Overall SnackAbility
Overall SnackAbility
Jobs
8/10
Housing
6
Affordability
6
Diversity
4
Safety
8.5
Amenities
8
Education
7
Commute
8.5
Vinton, IA Crime Report
22
Total Crimes
Total Crimes
435.1
Total Crimes / 100k People
Total Crimes / 100k People
-81.45%
Below National Average
Below National Average
| Statistic | Count Raw |
Vinton / 100k People |
Iowa / 100k People |
National / 100k People |
|---|---|---|---|---|
| Total Crimes Per 100K | 22 | 435.1 | 2,001.7 | 2,346.0 |
| Violent Crime | 6 | 118.7 | 303.5 | 387.8 |
| Murder | 0 | 0.0 | 3.5 | 6.5 |
| Robbery | 0 | 0.0 | 29.8 | 73.9 |
| Aggravated Assault | 5 | 98.9 | 229.4 | 279.7 |
| Property Crime | 16 | 316.5 | 1,698.2 | 1,958.2 |
| Burglary | 3 | 59.3 | 371.1 | 314.2 |
| Larceny | 13 | 257.1 | 1,130.1 | 1,398.0 |
| Car Theft | 0 | 0.0 | 197.1 | 246.0 |
Vinton, IA Cost Of Living
90
Vinton's Overall Cost Of Living
Vinton's Overall Cost Of Living
0.9x
Lower Than The National Average
Lower Than The National Average
| Living Expense | Vinton | Iowa | National Average | |
|---|---|---|---|---|
| Overall | 90 | 92 | 100 | |
| Services | 101 | 95 | 100 | |
| Groceries | 99 | 95 | 100 | |
| Health | 111 | 102 | 100 | |
| Housing | 62 | 74 | 100 | |
| Transportation | 99 | 100 | 100 | |
| Utilities | 108 | 99 | 100 | |
Vinton, IA Photos
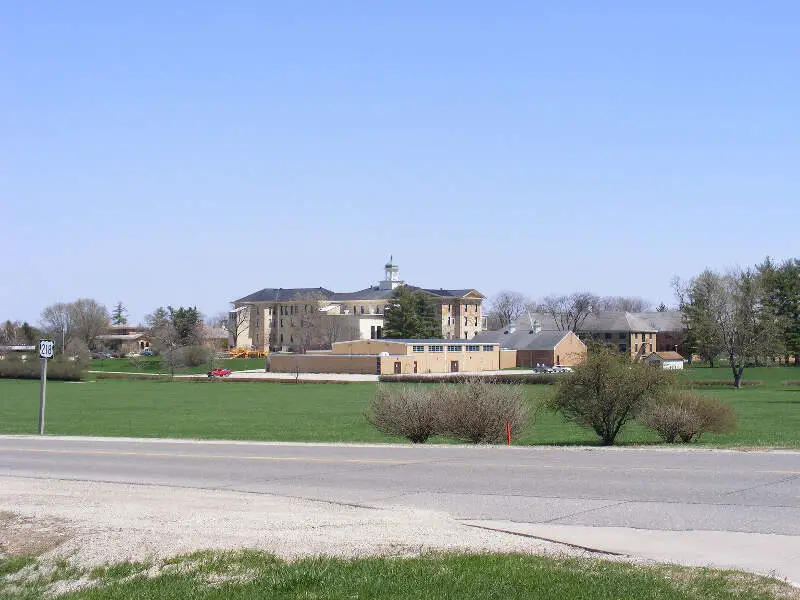
Source: Wikipedia User Torindkflt. | GFDL
Rankings for Vinton in Iowa


Map Of Vinton, IA
Best Places Around Vinton
1
North Liberty, IA
Population 19,159
2
Marion, IA
Population 39,910
3
Coralville, IA
Population 21,630
4
Waverly, IA
Population 10,172
5
Hiawatha, IA
Population 7,395
6
Central, LA
Population 29,235
7
Cedar Falls, IA
Population 40,750
8
Anamosa, IA
Population 5,484
9
Cedar Rapids, IA
Population 133,125
10
Independence, IA
Population 6,085
Population over time in Vinton
| Year | Population | % Change |
|---|---|---|
| 2020 | 5,075 | -1.0% |
| 2019 | 5,124 | -0.3% |
| 2018 | 5,141 | -0.5% |
| 2017 | 5,166 | -0.6% |
| 2016 | 5,197 | -0.3% |
| 2015 | 5,211 | -0.6% |
| 2014 | 5,241 | -0.2% |
| 2013 | 5,253 | -0.2% |
| 2012 | 5,261 | -0.0% |
| 2011 | 5,262 | - |
Race / Ethnicity in Vinton
| Race | Vinton | IA | USA |
|---|---|---|---|
| White | 93.7% | 85.0% | 60.1% |
| African American | 0.6% | 3.6% | 12.2% |
| American Indian | 0.6% | 0.3% | 0.6% |
| Asian | 0.4% | 2.5% | 5.6% |
| Hawaiian | 0.0% | 0.1% | 0.2% |
| Other | 0.0% | 0.1% | 0.3% |
| Two Or More | 1.8% | 2.2% | 2.8% |
| Hispanic | 2.9% | 6.2% | 18.2% |
Gender in Vinton
| Gender | Vinton | IA | USA |
|---|---|---|---|
| Female | 55.4% | 50.3% | 50.8% |
| Male | 44.6% | 49.7% | 49.2% |
Highest level of educational attainment in Vinton for adults over 25
| Education | Vinton | IA | USA |
|---|---|---|---|
| < 9th Grade | 2.0% | 1.0% | 5.0% |
| 9-12th Grade | 7.0% | 5.0% | 7.0% |
| High School / GED | 40.0% | 31.0% | 27.0% |
| Some College | 19.0% | 21.0% | 20.0% |
| Associate's Degree | 12.0% | 12.0% | 9.0% |
| Bachelor's Degree | 15.0% | 20.0% | 20.0% |
| Master's Degree | 4.0% | 7.0% | 9.0% |
| Professional Degree | 0.0% | 2.0% | 2.0% |
| Doctorate Degree | 1.0% | 1.0% | 1.0% |
Household Income For Vinton, Iowa
| Income | Vinton | IA | USA |
|---|---|---|---|
| Less than $10,000 | 3.0% | 5.1% | 5.8% |
| $10,000 to $14,999 | 13.7% | 4.0% | 4.1% |
| $15,000 to $24,999 | 7.4% | 8.6% | 8.5% |
| $25,000 to $34,999 | 15.6% | 9.3% | 8.6% |
| $35,000 to $49,999 | 17.6% | 13.1% | 12.0% |
| $50,000 to $74,999 | 17.3% | 19.1% | 17.2% |
| $75,000 to $99,999 | 7.8% | 14.3% | 12.8% |
| $100,000 to $149,999 | 9.2% | 15.9% | 15.6% |
| $150,000 to $199,999 | 3.7% | 5.6% | 7.1% |
| $200,000 or more | 4.7% | 5.0% | 8.3% |


