Oswego, IL
Quality of Life, Demographics, And Statistics
Living In Oswego, Illinois Summary
Life in Oswego research summary. HomeSnacks has been researching the quality of life in Oswego over the past eight years using Census data, FBI crime data, cost of living data, and other primary sources. Based on the most recently available data, we found the following about life in Oswego:
The population in Oswego is 34,324.
The median home value in Oswego is $273,500.
The median income in Oswego is $106,790.
The cost of living in Oswego is 109 which is 1.1x higher than the national average.
The median rent in Oswego is $1,551.
The unemployment rate in Oswego is 2.7%.
The poverty rate in Oswego is 2.2%.
Table Of Contents
Oswego SnackAbility
9.5
Overall SnackAbility
Overall SnackAbility
Jobs
9/10
Housing
8.5
Affordability
8
Diversity
8.5
Safety
9
Amenities
9
Education
8.5
Commute
4
Oswego, IL Cost Of Living
109
Oswego's Overall Cost Of Living
Oswego's Overall Cost Of Living
1.1x
Higher Than The National Average
Higher Than The National Average
| Living Expense | Oswego | Illinois | National Average | |
|---|---|---|---|---|
| Overall | 109 | 92 | 100 | |
| Services | 98 | 95 | 100 | |
| Groceries | 93 | 98 | 100 | |
| Health | 111 | 96 | 100 | |
| Housing | 138 | 81 | 100 | |
| Transportation | 111 | 105 | 100 | |
| Utilities | 87 | 90 | 100 | |
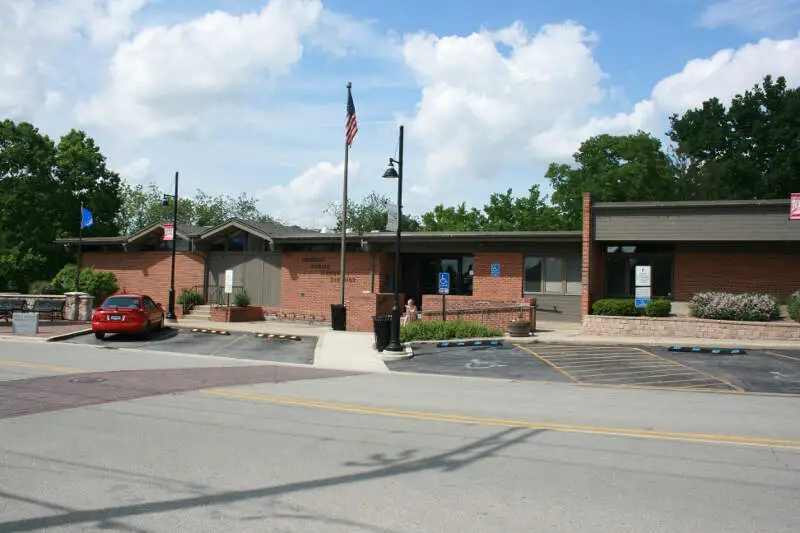
Oswego, IL Photos
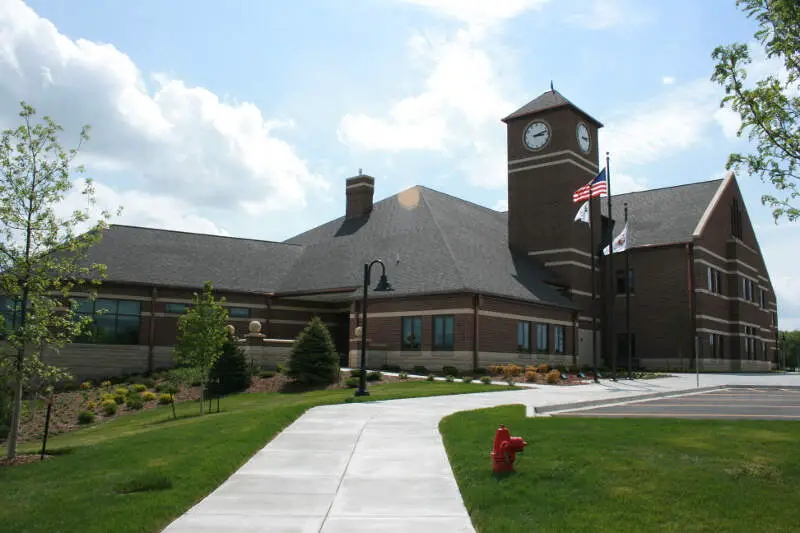
Source: Wikipedia User Jauerback | CC BY-SA 3.0
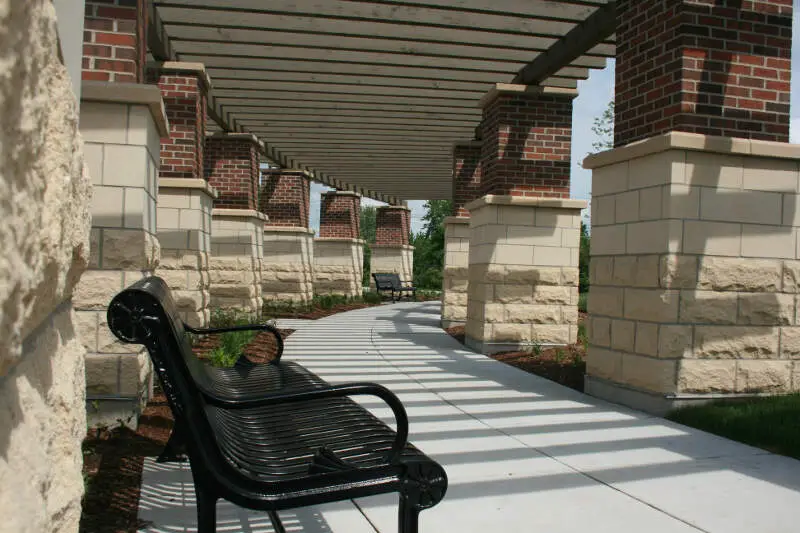
Source: Wikipedia User Jauerback | CC BY-SA 3.0
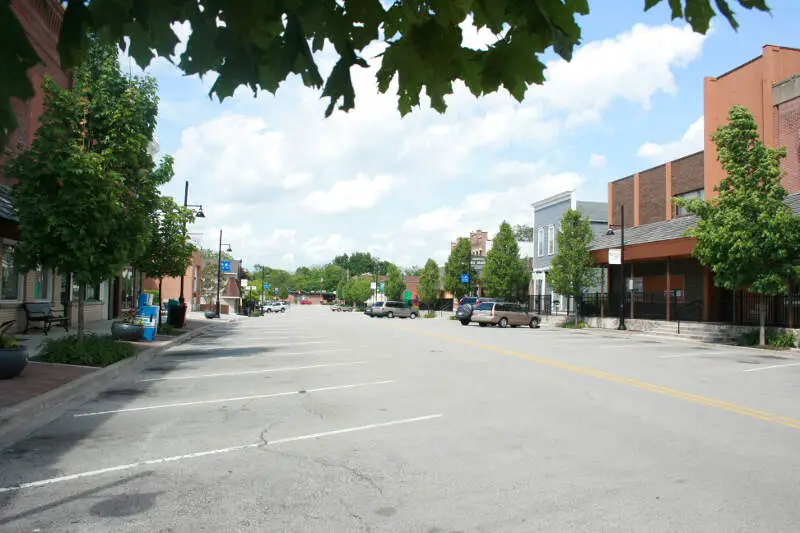
Source: Wikipedia User Jauerback | CC BY-SA 3.0
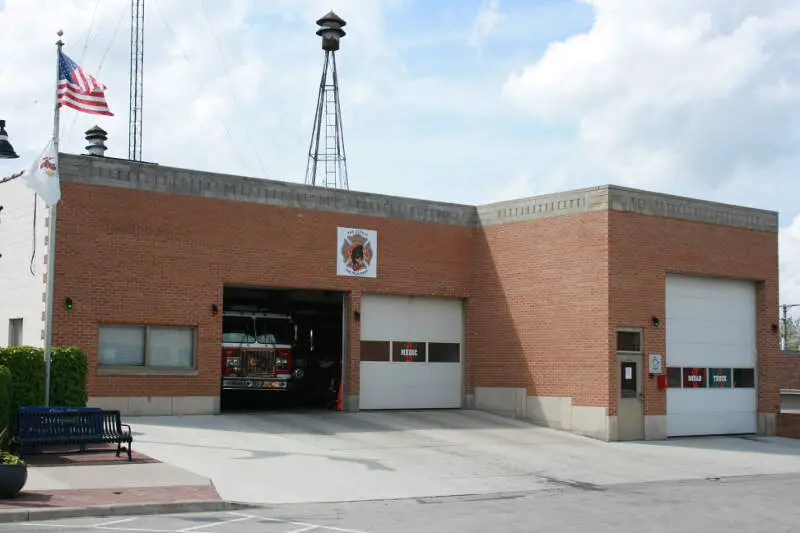
Source: Wikipedia User Jauerback | CC BY-SA 3.0
Source: Wikipedia User Jauerback | CC BY-SA 3.0

Source: Wikipedia User Jauerback | CC BY-SA 3.0

Source: Wikipedia User Jauerback | CC BY-SA 3.0

Source: Wikipedia User Jauerback | CC BY-SA 3.0

Source: Wikipedia User Jauerback | CC BY-SA 3.0
Rankings for Oswego in Illinois


Map Of Oswego, IL
Best Places Around Oswego
1
Winfield, IL
Population 9,852
2
Glen Ellyn, IL
Population 28,506
3
Wheaton, IL
Population 53,762
4
Naperville, IL
Population 149,013
5
Darien, IL
Population 22,087
6
Lisle, IL
Population 23,982
7
Carol Stream, IL
Population 39,895
8
Downers Grove, IL
Population 50,209
9
Woodridge, IL
Population 34,161
10
Lemont, IL
Population 17,535
Population over time in Oswego
| Year | Population | % Change |
|---|---|---|
| 2021 | 35,470 | 3.2% |
| 2020 | 34,383 | 1.8% |
| 2019 | 33,759 | 1.5% |
| 2018 | 33,245 | 2.4% |
| 2017 | 32,468 | 2.3% |
| 2016 | 31,723 | 2.2% |
| 2015 | 31,036 | 2.4% |
| 2014 | 30,302 | 3.9% |
| 2013 | 29,174 | 5.2% |
| 2012 | 27,719 | - |
Race / Ethnicity in Oswego
| Race | Oswego | IL | USA |
|---|---|---|---|
| White | 66.7% | 60.2% | 59.4% |
| African American | 8.0% | 13.8% | 12.2% |
| American Indian | 0.1% | 0.1% | 0.6% |
| Asian | 3.1% | 5.6% | 5.6% |
| Hawaiian | 0.0% | 0.0% | 0.2% |
| Other | 0.0% | 0.3% | 0.4% |
| Two Or More | 4.3% | 2.4% | 3.2% |
| Hispanic | 17.8% | 17.5% | 18.4% |
Gender in Oswego
| Gender | Oswego | IL | USA |
|---|---|---|---|
| Female | 51.7% | 50.6% | 50.5% |
| Male | 48.3% | 49.4% | 49.5% |
Highest level of educational attainment in Oswego for adults over 25
| Education | Oswego | IL | USA |
|---|---|---|---|
| < 9th Grade | 2.0% | 6.0% | 5.0% |
| 9-12th Grade | 3.0% | 6.0% | 6.0% |
| High School / GED | 22.0% | 25.0% | 26.0% |
| Some College | 19.0% | 20.0% | 20.0% |
| Associate's Degree | 12.0% | 8.0% | 9.0% |
| Bachelor's Degree | 26.0% | 22.0% | 21.0% |
| Master's Degree | 14.0% | 10.0% | 9.0% |
| Professional Degree | 1.0% | 2.0% | 2.0% |
| Doctorate Degree | 1.0% | 1.0% | 2.0% |
Household Income For Oswego, Illinois
| Income | Oswego | IL | USA |
|---|---|---|---|
| Less than $10,000 | 1.7% | 5.9% | 5.5% |
| $10,000 to $14,999 | 1.0% | 3.5% | 3.9% |
| $15,000 to $24,999 | 1.5% | 7.4% | 7.8% |
| $25,000 to $34,999 | 3.1% | 7.7% | 8.2% |
| $35,000 to $49,999 | 7.4% | 10.7% | 11.4% |
| $50,000 to $74,999 | 18.1% | 16.3% | 16.8% |
| $75,000 to $99,999 | 11.4% | 12.9% | 12.8% |
| $100,000 to $149,999 | 26.8% | 17.1% | 16.3% |
| $150,000 to $199,999 | 14.6% | 8.5% | 7.8% |
| $200,000 or more | 14.5% | 10.1% | 9.5% |


