Wilmette, IL
Quality of Life, Demographics, And Statistics
Living In Wilmette, Illinois Summary
Life in Wilmette research summary. HomeSnacks has been researching the quality of life in Wilmette over the past eight years using Census data, FBI crime data, cost of living data, and other primary sources. Based on the most recently available data, we found the following about life in Wilmette:
The population in Wilmette is 27,895.
The median home value in Wilmette is $710,400.
The median income in Wilmette is $173,967.
The cost of living in Wilmette is 166 which is 1.7x higher than the national average.
The median rent in Wilmette is $1,464.
The unemployment rate in Wilmette is 4.5%.
The poverty rate in Wilmette is 2.7%.
Table Of Contents
Wilmette SnackAbility
7
Overall SnackAbility
Overall SnackAbility
Jobs
8.5/10
Housing
9.5
Affordability
8
Diversity
8
Safety
N/A
Amenities
9.5
Education
10
Commute
3
Wilmette, IL Crime Report
350
Total Crimes
Total Crimes
1,289.4
Total Crimes / 100k People
Total Crimes / 100k People
-44.52%
Below National Average
Below National Average
| Statistic | Count Raw |
Wilmette / 100k People |
Illinois / 100k People |
National / 100k People |
|---|---|---|---|---|
| Total Crimes Per 100K | 350 | 1,289.4 | 1,985.3 | 2,324.2 |
| Violent Crime | 10 | 36.8 | 425.9 | 369.8 |
| Murder | 0 | 0.0 | 9.1 | 6.3 |
| Robbery | 3 | 11.1 | 97.4 | 66.1 |
| Aggravated Assault | 2 | 7.4 | 278.9 | 268.2 |
| Property Crime | 340 | 1,252.6 | 1,559.4 | 1,954.4 |
| Burglary | 43 | 158.4 | 246.4 | 269.8 |
| Larceny | 273 | 1,005.7 | 1,143.5 | 1,401.9 |
| Car Theft | 24 | 88.4 | 169.5 | 282.7 |
Wilmette, IL Cost Of Living
166
Wilmette's Overall Cost Of Living
Wilmette's Overall Cost Of Living
1.7x
Higher Than The National Average
Higher Than The National Average
| Living Expense | Wilmette | Illinois | National Average | |
|---|---|---|---|---|
| Overall | 166 | 92 | 100 | |
| Services | 116 | 95 | 100 | |
| Groceries | 108 | 98 | 100 | |
| Health | 100 | 96 | 100 | |
| Housing | 297 | 81 | 100 | |
| Transportation | 113 | 105 | 100 | |
| Utilities | 95 | 90 | 100 | |
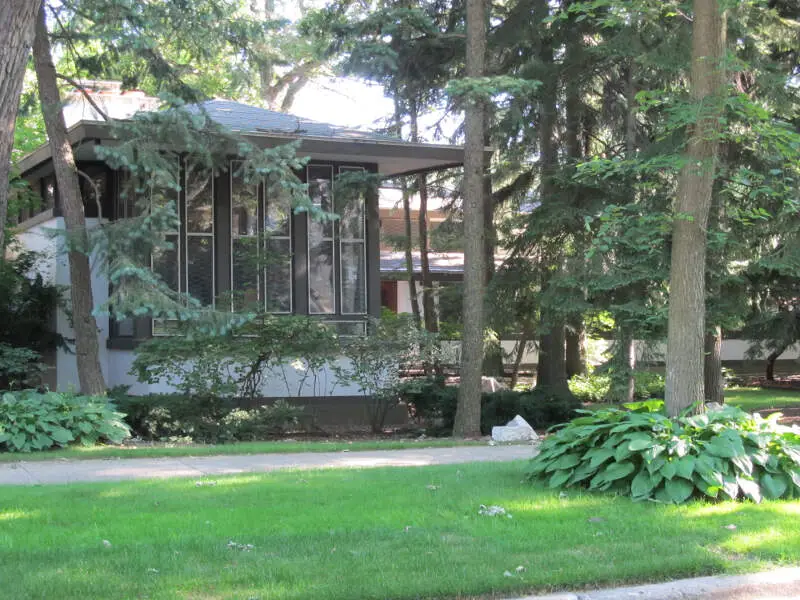
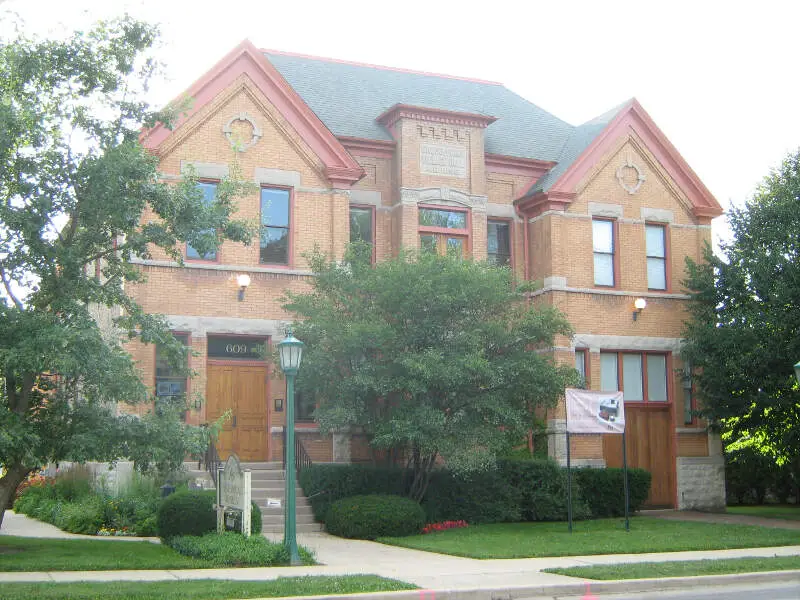
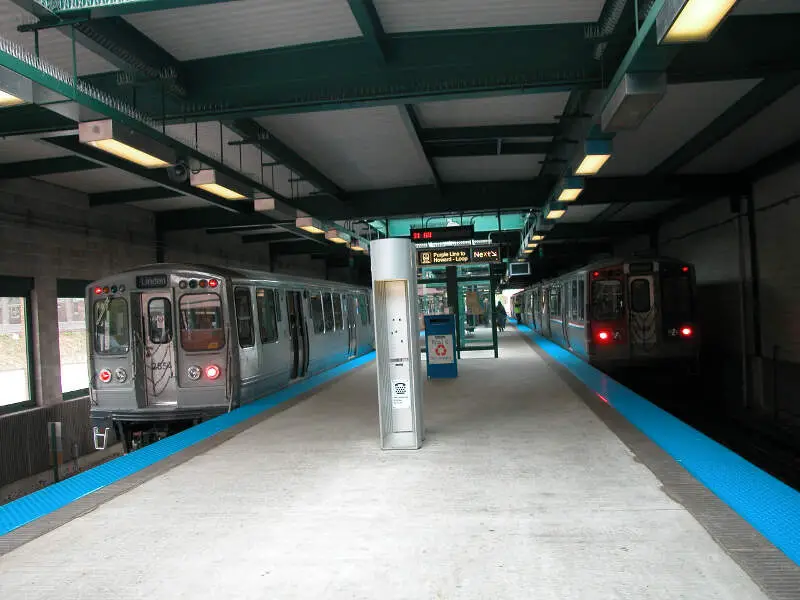
Wilmette, IL Photos

Rankings for Wilmette in Illinois


Map Of Wilmette, IL
Best Places Around Wilmette
1
Highland Park, IL
Population 30,245
2
Buffalo Grove, IL
Population 43,062
3
Deerfield, IL
Population 19,228
4
Northbrook, IL
Population 35,108
5
Elmhurst, IL
Population 45,661
6
Glenview, IL
Population 48,150
7
Park Ridge, IL
Population 39,562
8
Lake Bluff, IL
Population 5,878
9
Arlington Heights, IL
Population 77,283
10
Winnetka, IL
Population 12,658
Population over time in Wilmette
| Year | Population | % Change |
|---|---|---|
| 2021 | 27,114 | -1.1% |
| 2020 | 27,419 | 0.1% |
| 2019 | 27,393 | 0.1% |
| 2018 | 27,367 | -0.2% |
| 2017 | 27,420 | 0.3% |
| 2016 | 27,345 | 0.3% |
| 2015 | 27,268 | 0.2% |
| 2014 | 27,202 | 0.7% |
| 2013 | 27,010 | 0.3% |
| 2012 | 26,928 | - |
Race / Ethnicity in Wilmette
| Race | Wilmette | IL | USA |
|---|---|---|---|
| White | 80.9% | 60.2% | 59.4% |
| African American | 0.4% | 13.8% | 12.2% |
| American Indian | 0.1% | 0.1% | 0.6% |
| Asian | 12.3% | 5.6% | 5.6% |
| Hawaiian | 0.0% | 0.0% | 0.2% |
| Other | 0.5% | 0.3% | 0.4% |
| Two Or More | 2.7% | 2.4% | 3.2% |
| Hispanic | 3.2% | 17.5% | 18.4% |
Gender in Wilmette
| Gender | Wilmette | IL | USA |
|---|---|---|---|
| Female | 50.9% | 50.6% | 50.5% |
| Male | 49.1% | 49.4% | 49.5% |
Highest level of educational attainment in Wilmette for adults over 25
| Education | Wilmette | IL | USA |
|---|---|---|---|
| < 9th Grade | -0.0% | 6.0% | 5.0% |
| 9-12th Grade | 1.0% | 6.0% | 6.0% |
| High School / GED | 5.0% | 25.0% | 26.0% |
| Some College | 7.0% | 20.0% | 20.0% |
| Associate's Degree | 2.0% | 8.0% | 9.0% |
| Bachelor's Degree | 34.0% | 22.0% | 21.0% |
| Master's Degree | 31.0% | 10.0% | 9.0% |
| Professional Degree | 14.0% | 2.0% | 2.0% |
| Doctorate Degree | 6.0% | 1.0% | 2.0% |
Household Income For Wilmette, Illinois
| Income | Wilmette | IL | USA |
|---|---|---|---|
| Less than $10,000 | 2.6% | 5.9% | 5.5% |
| $10,000 to $14,999 | 0.9% | 3.5% | 3.9% |
| $15,000 to $24,999 | 3.0% | 7.4% | 7.8% |
| $25,000 to $34,999 | 3.0% | 7.7% | 8.2% |
| $35,000 to $49,999 | 4.3% | 10.7% | 11.4% |
| $50,000 to $74,999 | 9.1% | 16.3% | 16.8% |
| $75,000 to $99,999 | 7.9% | 12.9% | 12.8% |
| $100,000 to $149,999 | 14.4% | 17.1% | 16.3% |
| $150,000 to $199,999 | 10.2% | 8.5% | 7.8% |
| $200,000 or more | 44.7% | 10.1% | 9.5% |


