Frederick, MD
Quality of Life, Demographics, And Statistics
Living In Frederick, Maryland Summary
Life in Frederick research summary. HomeSnacks has been researching the quality of life in Frederick over the past eight years using Census data, FBI crime data, cost of living data, and other primary sources. Based on the most recently available data, we found the following about life in Frederick:
The population in Frederick is 76,376.
The median home value in Frederick is $289,000.
The median income in Frederick is $82,563.
The cost of living in Frederick is 116 which is 1.2x higher than the national average.
The median rent in Frederick is $1,478.
The unemployment rate in Frederick is 5.1%.
The poverty rate in Frederick is 10.1%.
Table Of Contents
Frederick SnackAbility
7
Overall SnackAbility
Overall SnackAbility
Jobs
8/10
Housing
8.5
Affordability
6
Diversity
9.5
Safety
N/A
Amenities
9
Education
8
Commute
4
Frederick, MD Crime Report
1,560
Total Crimes
Total Crimes
1,926.3
Total Crimes / 100k People
Total Crimes / 100k People
-17.12%
Below National Average
Below National Average
| Statistic | Count Raw |
Frederick / 100k People |
Maryland / 100k People |
National / 100k People |
|---|---|---|---|---|
| Total Crimes Per 100K | 1,560 | 1,926.3 | 2,009.7 | 2,324.2 |
| Violent Crime | 301 | 371.7 | 399.9 | 369.8 |
| Murder | 2 | 2.5 | 9.1 | 6.3 |
| Robbery | 40 | 49.4 | 118.5 | 66.1 |
| Aggravated Assault | 223 | 275.4 | 243.7 | 268.2 |
| Property Crime | 1,259 | 1,554.6 | 1,609.8 | 1,954.4 |
| Burglary | 174 | 214.9 | 252.0 | 269.8 |
| Larceny | 1,024 | 1,264.4 | 1,184.9 | 1,401.9 |
| Car Theft | 61 | 75.3 | 172.9 | 282.7 |
Frederick, MD Cost Of Living
116
Frederick's Overall Cost Of Living
Frederick's Overall Cost Of Living
1.2x
Higher Than The National Average
Higher Than The National Average
| Living Expense | Frederick | Maryland | National Average | |
|---|---|---|---|---|
| Overall | 116 | 120 | 100 | |
| Services | 114 | 109 | 100 | |
| Groceries | 114 | 108 | 100 | |
| Health | 88 | 92 | 100 | |
| Housing | 134 | 156 | 100 | |
| Transportation | 114 | 100 | 100 | |
| Utilities | 109 | 108 | 100 | |
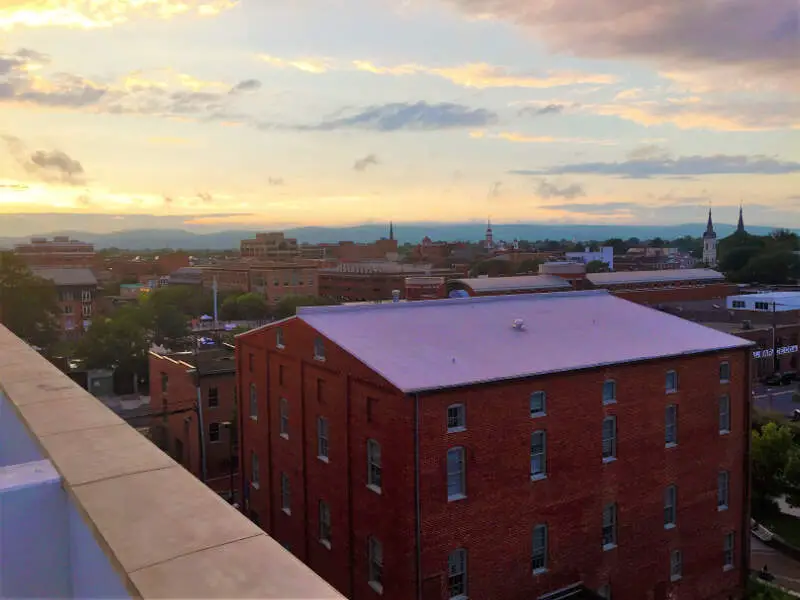
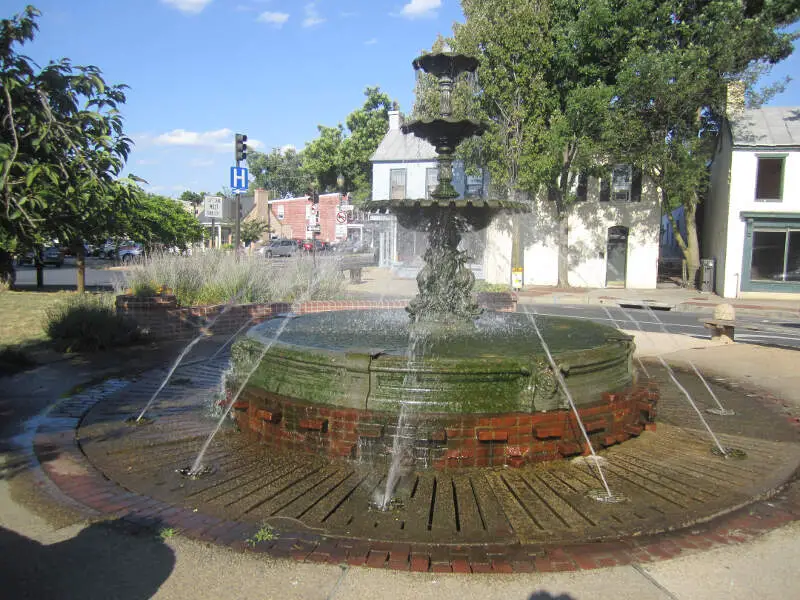
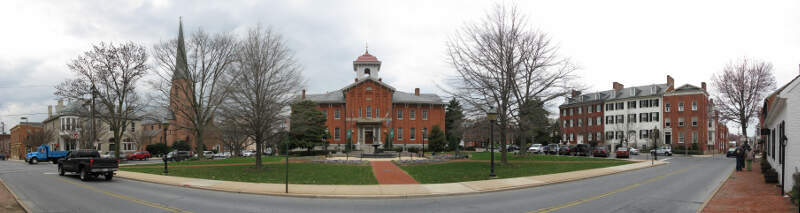
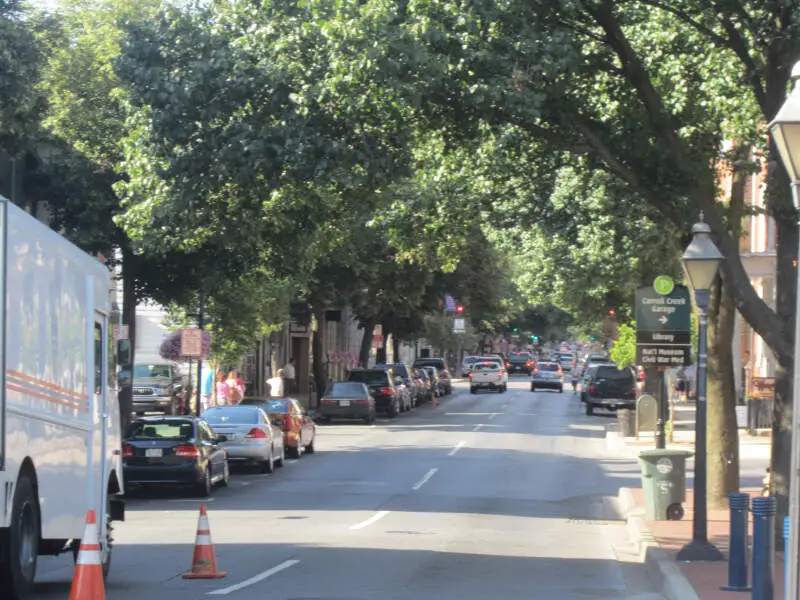
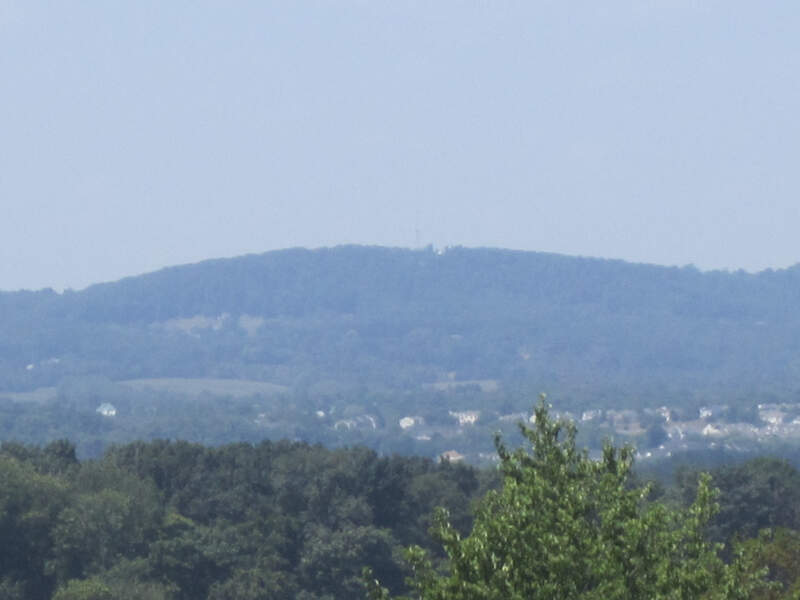
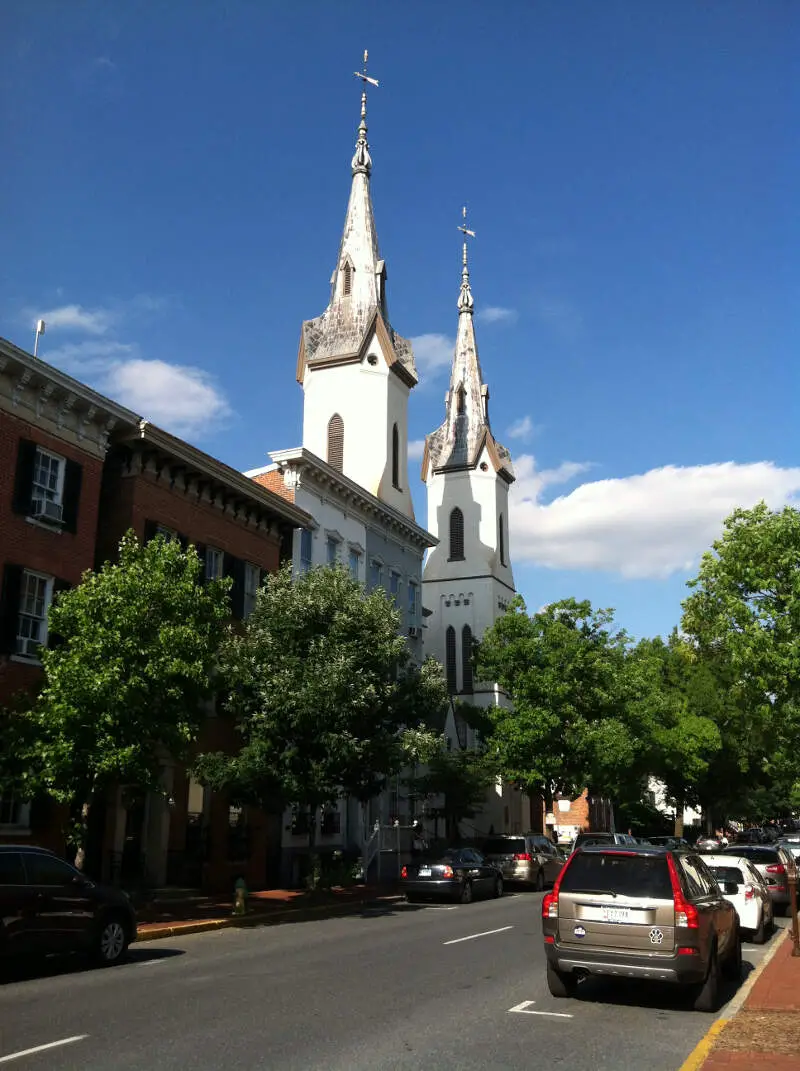
Frederick, MD Photos
Source: Wikipedia User Rollbama4 | CC BY-SA 4.0
Source: Wikipedia User Billy Hathorn | CC BY-SA 3.0
Source: Public Domain

Source: Wikipedia User Stacy | CC BY-SA 2.0
Source: Wikipedia User Billy Hathorn | CC BY-SA 3.0

Source: Wikipedia User Stacy | CC BY-SA 2.0
Source: Wikipedia User Billy Hathorn | CC BY-SA 3.0

Source: Wikipedia User Jweaver28 | CC BY-SA 3.0
Source: Wikipedia User Jweaver28 | CC BY-SA 3.0
Rankings for Frederick in Maryland


Map Of Frederick, MD
Best Places Around Frederick
1
Lyons, KS
Population 3,580
2
Ellsworth, KS
Population 3,012
3
McPherson, KS
Population 13,916
4
Russell, KS
Population 4,363
5
Salina, KS
Population 46,896
6
Great Bend, KS
Population 14,864
7
Hutchinson, KS
Population 40,202
8
Lindsborg, KS
Population 3,512
Population over time in Frederick
| Year | Population | % Change |
|---|---|---|
| 2021 | 71,843 | 2.4% |
| 2020 | 70,166 | 1.2% |
| 2019 | 69,330 | 1.6% |
| 2018 | 68,229 | 1.2% |
| 2017 | 67,421 | 1.2% |
| 2016 | 66,646 | 1.2% |
| 2015 | 65,840 | 1.0% |
| 2014 | 65,171 | 0.9% |
| 2013 | 64,593 | 1.4% |
| 2012 | 63,731 | - |
Race / Ethnicity in Frederick
| Race | Frederick | MD | USA |
|---|---|---|---|
| White | 54.9% | 49.4% | 59.4% |
| African American | 17.1% | 29.4% | 12.2% |
| American Indian | 0.2% | 0.2% | 0.6% |
| Asian | 5.1% | 6.4% | 5.6% |
| Hawaiian | 0.0% | 0.0% | 0.2% |
| Other | 0.2% | 0.5% | 0.4% |
| Two Or More | 4.9% | 3.6% | 3.2% |
| Hispanic | 17.5% | 10.6% | 18.4% |
Gender in Frederick
| Gender | Frederick | MD | USA |
|---|---|---|---|
| Female | 51.0% | 51.3% | 50.5% |
| Male | 49.0% | 48.7% | 49.5% |
Highest level of educational attainment in Frederick for adults over 25
| Education | Frederick | MD | USA |
|---|---|---|---|
| < 9th Grade | 5.0% | 4.0% | 5.0% |
| 9-12th Grade | 5.0% | 5.0% | 6.0% |
| High School / GED | 22.0% | 24.0% | 26.0% |
| Some College | 18.0% | 18.0% | 20.0% |
| Associate's Degree | 9.0% | 7.0% | 9.0% |
| Bachelor's Degree | 23.0% | 22.0% | 21.0% |
| Master's Degree | 14.0% | 14.0% | 9.0% |
| Professional Degree | 2.0% | 3.0% | 2.0% |
| Doctorate Degree | 2.0% | 3.0% | 2.0% |
Household Income For Frederick, Maryland
| Income | Frederick | MD | USA |
|---|---|---|---|
| Less than $10,000 | 3.6% | 4.5% | 5.5% |
| $10,000 to $14,999 | 2.7% | 2.6% | 3.9% |
| $15,000 to $24,999 | 4.2% | 5.2% | 7.8% |
| $25,000 to $34,999 | 6.4% | 5.7% | 8.2% |
| $35,000 to $49,999 | 10.0% | 8.9% | 11.4% |
| $50,000 to $74,999 | 18.3% | 14.7% | 16.8% |
| $75,000 to $99,999 | 14.5% | 12.6% | 12.8% |
| $100,000 to $149,999 | 19.2% | 19.4% | 16.3% |
| $150,000 to $199,999 | 11.2% | 11.5% | 7.8% |
| $200,000 or more | 9.9% | 15.0% | 9.5% |


