Hannibal, MO
Quality of Life, Demographics, And Statistics
Living In Hannibal, Missouri Summary
Life in Hannibal research summary. HomeSnacks has been researching the quality of life in Hannibal over the past eight years using Census data, FBI crime data, cost of living data, and other primary sources. Based on the most recently available data, we found the following about life in Hannibal:
The population in Hannibal is 17,165.
The median home value in Hannibal is $115,900.
The median income in Hannibal is $47,500.
The cost of living in Hannibal is 86 which is 0.9x lower than the national average.
The median rent in Hannibal is $717.
The unemployment rate in Hannibal is 5.3%.
The poverty rate in Hannibal is 21.4%.
Table Of Contents
Hannibal SnackAbility
4
Overall SnackAbility
Overall SnackAbility
Jobs
6/10
Housing
5
Affordability
8
Diversity
6
Safety
4
Amenities
8
Education
6
Commute
9.5
Hannibal, MO Crime Report
649
Total Crimes
Total Crimes
3,811.4
Total Crimes / 100k People
Total Crimes / 100k People
63.99%
Above National Average
Above National Average
| Statistic | Count Raw |
Hannibal / 100k People |
Missouri / 100k People |
National / 100k People |
|---|---|---|---|---|
| Total Crimes Per 100K | 649 | 3,811.4 | 3,073.7 | 2,324.2 |
| Violent Crime | 80 | 469.8 | 542.7 | 369.8 |
| Murder | 2 | 11.7 | 11.8 | 6.3 |
| Robbery | 6 | 35.2 | 74.4 | 66.1 |
| Aggravated Assault | 66 | 387.6 | 413.3 | 268.2 |
| Property Crime | 569 | 3,341.6 | 2,531.0 | 1,954.4 |
| Burglary | 64 | 375.9 | 378.8 | 269.8 |
| Larceny | 444 | 2,607.5 | 1,759.1 | 1,401.9 |
| Car Theft | 61 | 358.2 | 393.2 | 282.7 |
Hannibal, MO Cost Of Living
86
Hannibal's Overall Cost Of Living
Hannibal's Overall Cost Of Living
0.9x
Lower Than The National Average
Lower Than The National Average
| Living Expense | Hannibal | Missouri | National Average | |
|---|---|---|---|---|
| Overall | 86 | 89 | 100 | |
| Services | 98 | 92 | 100 | |
| Groceries | 101 | 96 | 100 | |
| Health | 99 | 88 | 100 | |
| Housing | 53 | 79 | 100 | |
| Transportation | 88 | 95 | 100 | |
| Utilities | 99 | 95 | 100 | |
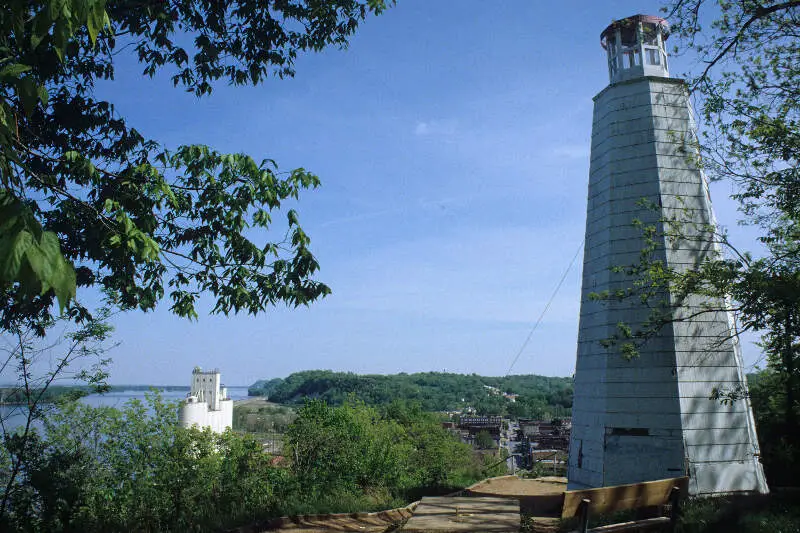
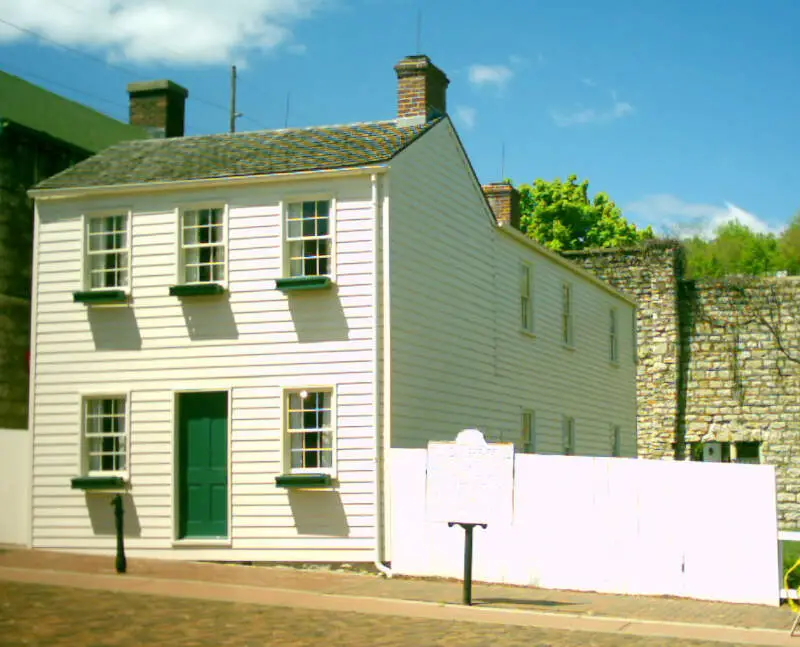
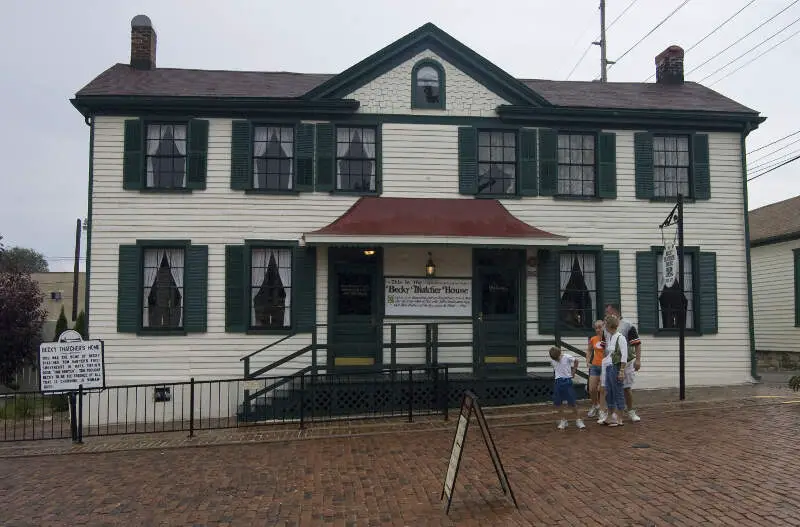
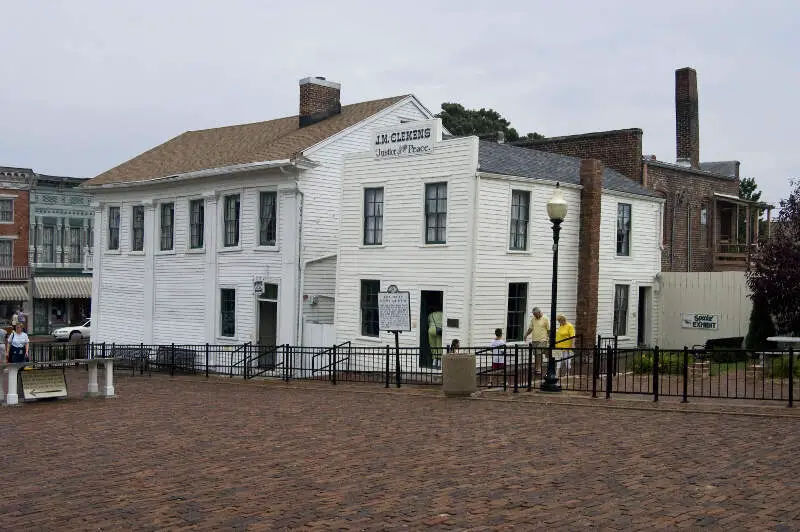
Hannibal, MO Photos
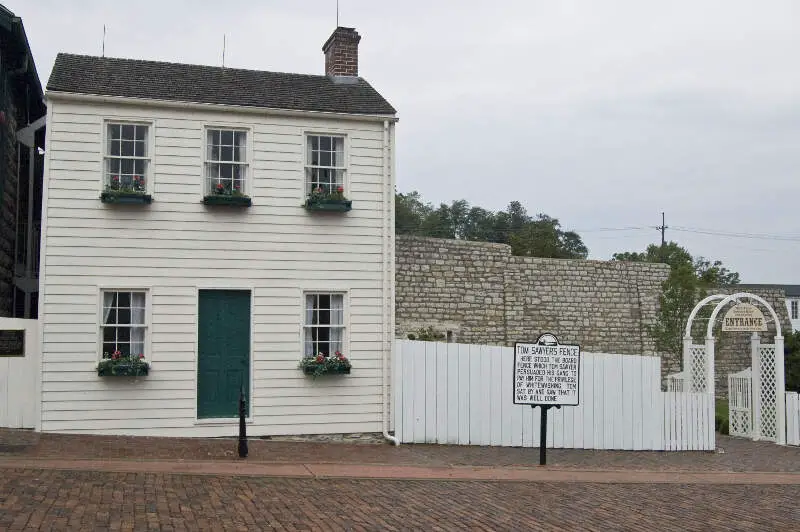
Source: Wikipedia User Andrew Balet | CC BY-SA 3.0
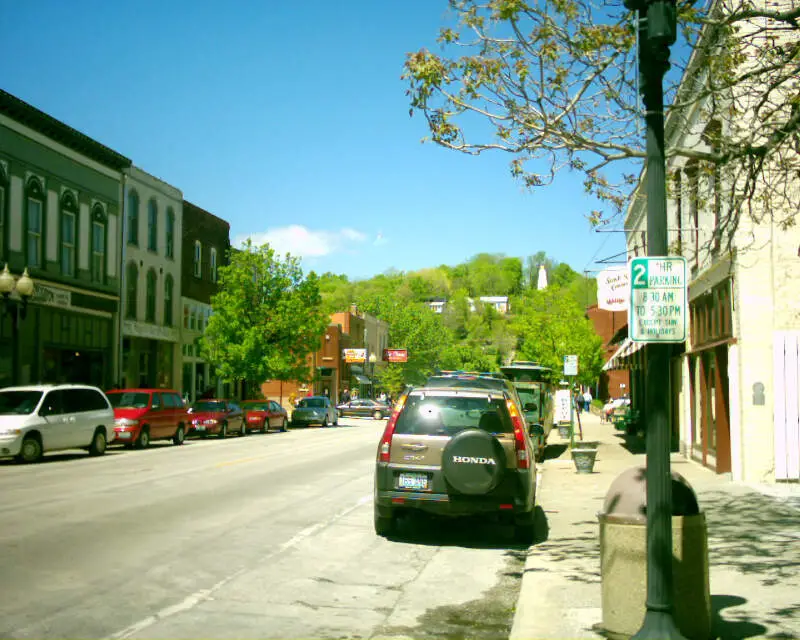
Source: Wikipedia User Andrew Balet | CC BY-SA 2.5

Source: Wikipedia User Andrew Balet | CC BY 2.5

Source: Wikipedia User Kelly Martin | GFDL
Source: Wikipedia User Jens Bludau | CC BY-SA 3.0
Source: Wikipedia User Andrew Balet | CC BY 2.5
Source: Wikipedia User Andrew Balet | CC BY-SA 3.0

Source: Wikipedia User Andrew Balet | CC BY-SA 3.0
Source: Wikipedia User Andrew Balet | CC BY-SA 3.0
Rankings for Hannibal in Missouri


Map Of Hannibal, MO
Best Places Around Hannibal
1
Quincy, IL
Population 39,687
2
Bowling Green, MO
Population 4,391
3
Middletown, NY
Population 30,086
4
Mexico, MO
Population 11,592
5
Monroe, NC
Population 34,464
6
Lewistown, MT
Population 5,967
7
Valley, NE
Population 2,982
8
Keokuk, IA
Population 9,977
Population over time in Hannibal
| Year | Population | % Change |
|---|---|---|
| 2021 | 17,312 | -1.5% |
| 2020 | 17,575 | 0.1% |
| 2019 | 17,551 | -0.9% |
| 2018 | 17,707 | -0.1% |
| 2017 | 17,717 | -0.3% |
| 2016 | 17,779 | -0.4% |
| 2015 | 17,844 | 0.1% |
| 2014 | 17,835 | 0.1% |
| 2013 | 17,816 | -0.0% |
| 2012 | 17,821 | - |
Race / Ethnicity in Hannibal
| Race | Hannibal | MO | USA |
|---|---|---|---|
| White | 87.1% | 78.2% | 59.4% |
| African American | 6.1% | 11.2% | 12.2% |
| American Indian | 0.2% | 0.2% | 0.6% |
| Asian | 0.5% | 2.0% | 5.6% |
| Hawaiian | 0.2% | 0.1% | 0.2% |
| Other | 0.3% | 0.3% | 0.4% |
| Two Or More | 2.7% | 3.5% | 3.2% |
| Hispanic | 3.0% | 4.4% | 18.4% |
Gender in Hannibal
| Gender | Hannibal | MO | USA |
|---|---|---|---|
| Female | 52.5% | 50.7% | 50.5% |
| Male | 47.5% | 49.3% | 49.5% |
Highest level of educational attainment in Hannibal for adults over 25
| Education | Hannibal | MO | USA |
|---|---|---|---|
| < 9th Grade | 4.0% | 3.0% | 5.0% |
| 9-12th Grade | 9.0% | 6.0% | 6.0% |
| High School / GED | 37.0% | 30.0% | 26.0% |
| Some College | 22.0% | 22.0% | 20.0% |
| Associate's Degree | 6.0% | 8.0% | 9.0% |
| Bachelor's Degree | 14.0% | 19.0% | 21.0% |
| Master's Degree | 6.0% | 9.0% | 9.0% |
| Professional Degree | 1.0% | 2.0% | 2.0% |
| Doctorate Degree | 1.0% | 1.0% | 2.0% |
Household Income For Hannibal, Missouri
| Income | Hannibal | MO | USA |
|---|---|---|---|
| Less than $10,000 | 8.6% | 5.6% | 5.5% |
| $10,000 to $14,999 | 5.7% | 4.3% | 3.9% |
| $15,000 to $24,999 | 12.4% | 8.8% | 7.8% |
| $25,000 to $34,999 | 10.9% | 9.5% | 8.2% |
| $35,000 to $49,999 | 15.2% | 13.0% | 11.4% |
| $50,000 to $74,999 | 19.1% | 18.2% | 16.8% |
| $75,000 to $99,999 | 10.5% | 13.3% | 12.8% |
| $100,000 to $149,999 | 13.7% | 15.1% | 16.3% |
| $150,000 to $199,999 | 2.3% | 6.1% | 7.8% |
| $200,000 or more | 1.4% | 6.0% | 9.5% |


