Glendive, MT
Quality of Life, Demographics, And Statistics
HomeSnacks is reader-supported. When you click through real estate links on our site, we earn an affiliate commission. Learn more.
Glendive, Montana Info Snack
Table Of Contents
Population
5,030
Unemployment
2.9%
Poverty
10.8%
Median Home
$142,600
Median Income
$47,541
Median Rent
$687
Glendive SnackAbility
8.5
Overall SnackAbility
Overall SnackAbility
Jobs
8/10
Housing
6
Affordability
8
Diversity
4
Safety
8.5
Amenities
8
Education
8
Commute
9.5
Glendive, MT Crime Report
35
Total Crimes
Total Crimes
713.1
Total Crimes / 100k People
Total Crimes / 100k People
-69.60%
Below National Average
Below National Average
| Statistic | Count Raw |
Glendive / 100k People |
Montana / 100k People |
National / 100k People |
|---|---|---|---|---|
| Total Crimes Per 100K | 35 | 713.1 | 2,590.7 | 2,346.0 |
| Violent Crime | 6 | 122.2 | 469.8 | 387.8 |
| Murder | 0 | 0.0 | 5.0 | 6.5 |
| Robbery | 0 | 0.0 | 25.8 | 73.9 |
| Aggravated Assault | 5 | 101.9 | 383.7 | 279.7 |
| Property Crime | 29 | 590.9 | 2,120.8 | 1,958.2 |
| Burglary | 10 | 203.7 | 270.1 | 314.2 |
| Larceny | 13 | 264.9 | 1,603.0 | 1,398.0 |
| Car Theft | 6 | 122.2 | 247.6 | 246.0 |
Glendive, MT Cost Of Living
95
Glendive's Overall Cost Of Living
Glendive's Overall Cost Of Living
0.9x
Lower Than The National Average
Lower Than The National Average
| Living Expense | Glendive | Montana | National Average | |
|---|---|---|---|---|
| Overall | 95 | 97 | 100 | |
| Services | 100 | 99 | 100 | |
| Groceries | 100 | 99 | 100 | |
| Health | 117 | 100 | 100 | |
| Housing | 80 | 100 | 100 | |
| Transportation | 106 | 94 | 100 | |
| Utilities | 89 | 87 | 100 | |
Glendive, MT Photos
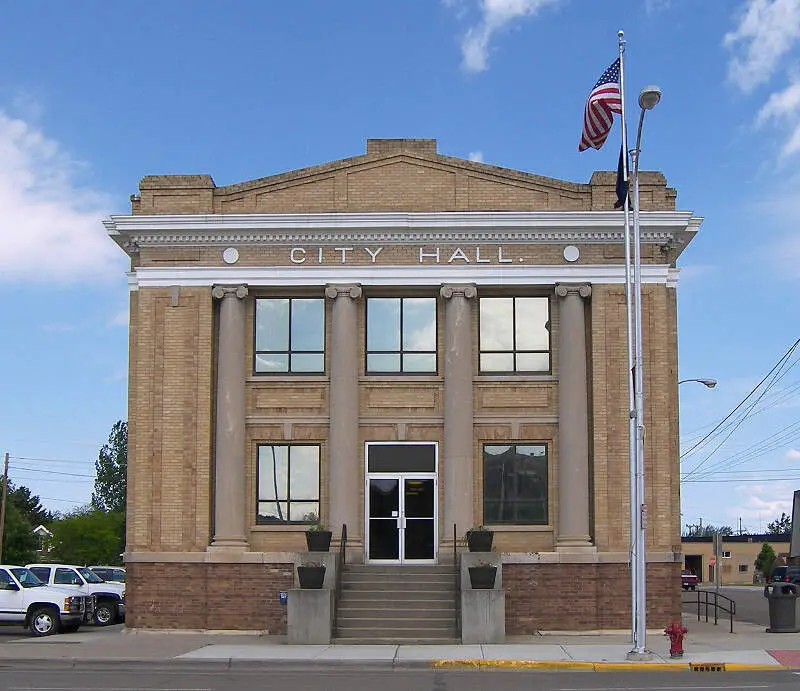
Source: Wikipedia User Larry D. Moore | CC BY-SA 3.0
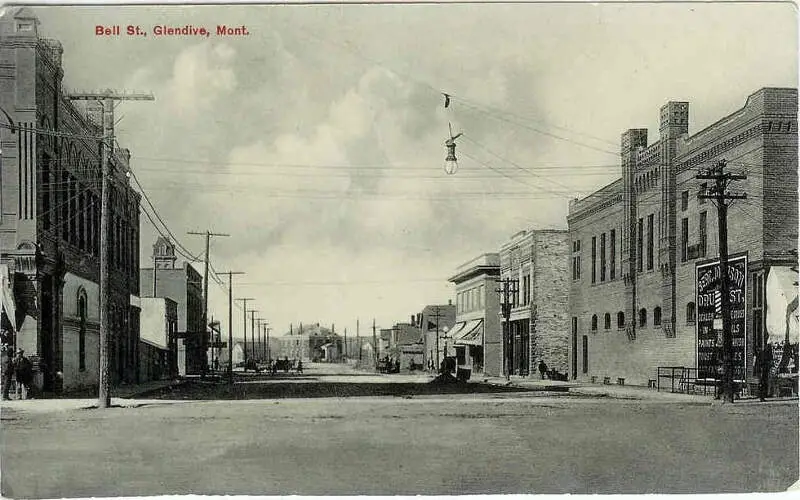
Source: Public Domain
Rankings for Glendive in Montana


Map Of Glendive, MT
Population over time in Glendive
| Year | Population | % Change |
|---|---|---|
| 2020 | 5,030 | -3.9% |
| 2019 | 5,232 | -1.0% |
| 2018 | 5,285 | -1.3% |
| 2017 | 5,353 | 1.3% |
| 2016 | 5,284 | 2.3% |
| 2015 | 5,167 | 1.6% |
| 2014 | 5,086 | 1.9% |
| 2013 | 4,990 | 1.4% |
| 2012 | 4,920 | 0.4% |
| 2011 | 4,899 | - |
Race / Ethnicity in Glendive
| Race | Glendive | MT | USA |
|---|---|---|---|
| White | 95.0% | 85.6% | 60.1% |
| African American | 0.9% | 0.5% | 12.2% |
| American Indian | 0.8% | 5.9% | 0.6% |
| Asian | 0.0% | 0.8% | 5.6% |
| Hawaiian | 0.0% | 0.1% | 0.2% |
| Other | 0.0% | 0.2% | 0.3% |
| Two Or More | 0.7% | 3.1% | 2.8% |
| Hispanic | 2.6% | 3.9% | 18.2% |
Gender in Glendive
| Gender | Glendive | MT | USA |
|---|---|---|---|
| Female | 47.6% | 49.7% | 50.8% |
| Male | 52.4% | 50.3% | 49.2% |
Highest level of educational attainment in Glendive for adults over 25
| Education | Glendive | MT | USA |
|---|---|---|---|
| < 9th Grade | -0.0% | 4.0% | 5.0% |
| 9-12th Grade | 9.0% | 4.0% | 7.0% |
| High School / GED | 25.0% | 28.0% | 27.0% |
| Some College | 17.0% | 23.0% | 20.0% |
| Associate's Degree | 20.0% | 9.0% | 9.0% |
| Bachelor's Degree | 21.0% | 22.0% | 20.0% |
| Master's Degree | 6.0% | 7.0% | 9.0% |
| Professional Degree | 2.0% | 2.0% | 2.0% |
| Doctorate Degree | 0.0% | 1.0% | 1.0% |
Household Income For Glendive, Montana
| Income | Glendive | MT | USA |
|---|---|---|---|
| Less than $10,000 | 2.0% | 5.7% | 5.8% |
| $10,000 to $14,999 | 8.9% | 4.9% | 4.1% |
| $15,000 to $24,999 | 7.1% | 9.6% | 8.5% |
| $25,000 to $34,999 | 13.8% | 10.5% | 8.6% |
| $35,000 to $49,999 | 23.6% | 13.5% | 12.0% |
| $50,000 to $74,999 | 20.5% | 19.2% | 17.2% |
| $75,000 to $99,999 | 7.8% | 12.8% | 12.8% |
| $100,000 to $149,999 | 12.2% | 13.8% | 15.6% |
| $150,000 to $199,999 | 1.8% | 5.4% | 7.1% |
| $200,000 or more | 2.3% | 4.7% | 8.3% |


