Living in Demarest, NJ
Demarest, New Jersey Info Snack
Table Of Contents
Population
4,942
Unemployment
4.1%
Poverty
3.3%
Median Home
$681,500
Median Income
$154,500
Median Rent
$2,773
Demarest SnackAbility
10
Overall SnackAbility
Overall SnackAbility
Jobs
8.5/10
Housing
10
Affordability
5
Diversity
9
Safety
9.5
Amenities
8
Education
9.5
Commute
3
Demarest, NJ Crime Report
14
Total Crimes
Total Crimes
285.0
Total Crimes / 100k People
Total Crimes / 100k People
-88.49%
Below National Average
Below National Average
| Statistic | Count Raw |
Demarest / 100k People |
New Jersey / 100k People |
National / 100k People |
|---|---|---|---|---|
| Total Crimes Per 100K | 14 | 285.0 | 1,542.5 | 2,476.7 |
| Violent Crime | 2 | 40.7 | 206.9 | 366.7 |
| Murder | 0 | 0.0 | 2.9 | 5.0 |
| Robbery | 0 | 0.0 | 64.5 | 81.6 |
| Aggravated Assault | 2 | 40.7 | 122.2 | 250.2 |
| Property Crime | 12 | 244.3 | 1,335.7 | 2,109.9 |
| Burglary | 4 | 81.4 | 184.6 | 340.5 |
| Larceny | 5 | 101.8 | 1,034.7 | 1,549.5 |
| Car Theft | 3 | 61.1 | 116.4 | 219.9 |
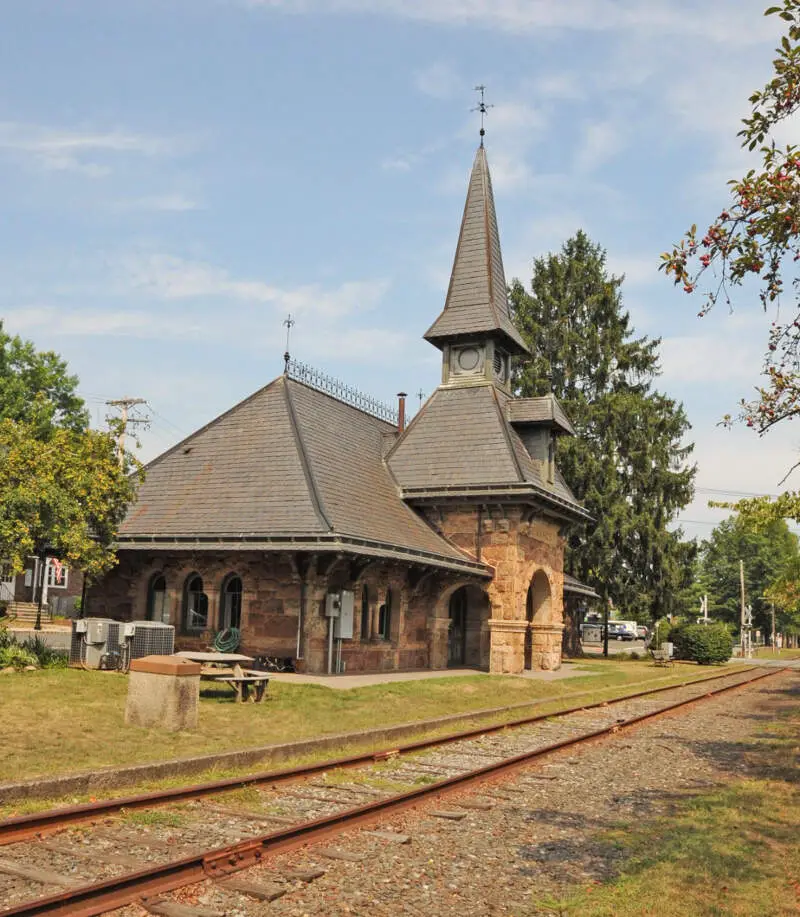
Demarest, NJ Photos
Rankings for Demarest in New Jersey


Map Of Demarest, NJ
Best Places Around Demarest
1
Bronxville, NY
Population 6,409
2
Pelham Manor, NY
Population 5,569
3
Pleasantville, NY
Population 7,221
4
Larchmont, NY
Population 6,096
5
Briarcliff Manor, NY
Population 7,616
6
Port Washington, NY
Population 15,808
7
Tappan, NY
Population 7,227
8
Irvington, NY
Population 6,529
9
Mamaroneck, NY
Population 19,217
10
Blauvelt, NY
Population 5,152
Population over time in Demarest
| Year | Population | % Change |
|---|---|---|
| 2019 | 4,942 | -0.3% |
| 2018 | 4,959 | -1.4% |
| 2017 | 5,031 | 0.5% |
| 2016 | 5,007 | 0.1% |
| 2015 | 5,004 | 1.5% |
| 2014 | 4,929 | 0.5% |
| 2013 | 4,904 | -0.1% |
| 2012 | 4,909 | 0.9% |
| 2011 | 4,865 | 0.3% |
| 2010 | 4,850 | - |
Race / Ethnicity in Demarest
| Race | Demarest | NJ | USA |
|---|---|---|---|
| White | 59.2% | 55.4% | 60.7% |
| African American | 0.1% | 12.7% | 12.3% |
| American Indian | 0.0% | 0.1% | 0.7% |
| Asian | 28.7% | 9.4% | 5.5% |
| Hawaiian | 0.0% | 0.0% | 0.2% |
| Other | 0.4% | 0.4% | 0.2% |
| Two Or More | 1.6% | 1.8% | 2.4% |
| Hispanic | 9.9% | 20.2% | 18.0% |
Gender in Demarest
| Gender | Demarest | NJ | USA |
|---|---|---|---|
| Female | 51.6% | 51.2% | 50.8% |
| Male | 48.4% | 48.8% | 49.2% |
Highest level of educational attainment in Demarest for adults over 25
| Education | Demarest | NJ | USA |
|---|---|---|---|
| < 9th Grade | 1.0% | 5.0% | 6.0% |
| 9-12th Grade | 2.0% | 5.0% | 7.0% |
| High School / GED | 9.0% | 27.0% | 27.0% |
| Some College | 14.0% | 16.0% | 20.0% |
| Associate's Degree | 3.0% | 7.0% | 8.0% |
| Bachelor's Degree | 45.0% | 24.0% | 20.0% |
| Master's Degree | 15.0% | 11.0% | 9.0% |
| Professional Degree | 9.0% | 3.0% | 2.0% |
| Doctorate Degree | 2.0% | 2.0% | 1.0% |
Household Income For Demarest, New Jersey
| Income | Demarest | NJ | USA |
|---|---|---|---|
| Less than $10,000 | 3.0% | 4.9% | 6.0% |
| $10,000 to $14,999 | 1.9% | 3.2% | 4.3% |
| $15,000 to $24,999 | 2.0% | 7.1% | 8.9% |
| $25,000 to $34,999 | 1.7% | 6.9% | 8.9% |
| $35,000 to $49,999 | 9.2% | 9.4% | 12.3% |
| $50,000 to $74,999 | 6.1% | 14.6% | 17.2% |
| $75,000 to $99,999 | 7.4% | 12.1% | 12.7% |
| $100,000 to $149,999 | 16.7% | 17.7% | 15.1% |
| $150,000 to $199,999 | 15.5% | 10.1% | 6.8% |
| $200,000 or more | 36.5% | 14.0% | 7.7% |


