Loudon, TN
Quality of Life, Demographics, And Statistics
HomeSnacks is reader-supported. When you click through real estate links on our site, we earn an affiliate commission. Learn more.
Loudon, Tennessee Info Snack
Table Of Contents
Population
5,747
Unemployment
5.5%
Poverty
13.3%
Median Home
$123,300
Median Income
$41,860
Median Rent
$743
Loudon SnackAbility
6
Overall SnackAbility
Overall SnackAbility
Jobs
6/10
Housing
6
Affordability
6
Diversity
8
Safety
8.5
Amenities
6
Education
4
Commute
8.5
Loudon, TN Crime Report
57
Total Crimes
Total Crimes
971.2
Total Crimes / 100k People
Total Crimes / 100k People
-60.79%
Below National Average
Below National Average
| Statistic | Count Raw |
Loudon / 100k People |
Tennessee / 100k People |
National / 100k People |
|---|---|---|---|---|
| Total Crimes Per 100K | 57 | 971.2 | 3,247.8 | 2,476.7 |
| Violent Crime | 5 | 85.2 | 595.2 | 366.7 |
| Murder | 0 | 0.0 | 7.3 | 5.0 |
| Robbery | 0 | 0.0 | 90.1 | 81.6 |
| Aggravated Assault | 3 | 51.1 | 456.7 | 250.2 |
| Property Crime | 52 | 886.0 | 2,652.6 | 2,109.9 |
| Burglary | 6 | 102.2 | 437.4 | 340.5 |
| Larceny | 42 | 715.6 | 1,934.4 | 1,549.5 |
| Car Theft | 4 | 68.2 | 280.9 | 219.9 |
Loudon, TN Cost Of Living
79
Loudon's Overall Cost Of Living
Loudon's Overall Cost Of Living
0.8x
Lower Than The National Average
Lower Than The National Average
| Living Expense | Loudon | Tennessee | National Average | |
|---|---|---|---|---|
| Overall | 79 | 89 | 100 | |
| Services | 85 | 93 | 100 | |
| Groceries | 89 | 95 | 100 | |
| Health | 92 | 89 | 100 | |
| Housing | 60 | 80 | 100 | |
| Transportation | 83 | 88 | 100 | |
| Utilities | 93 | 96 | 100 | |
Loudon, TN Photos
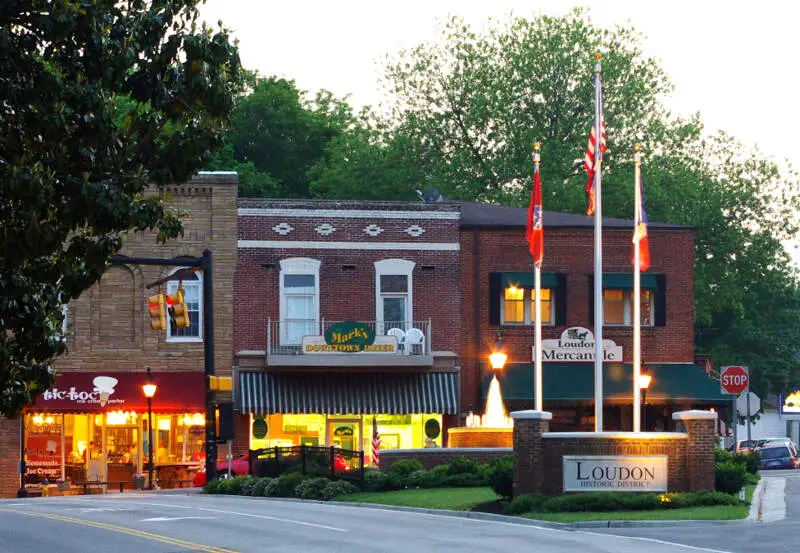
Source: Wikipedia User Brian Stansberry | CC BY 3.0
Rankings for Loudon in Tennessee


Map Of Loudon, TN
Best Places Around Loudon
1
Farragut, TN
Population 22,631
2
Kingston, TN
Population 5,927
3
Oak Ridge, TN
Population 29,037
4
Sweetwater, TN
Population 5,873
5
Rockwood, TN
Population 5,423
6
Harriman, TN
Population 6,126
Population over time in Loudon
| Year | Population | % Change |
|---|---|---|
| 2019 | 5,747 | 1.1% |
| 2018 | 5,687 | -0.2% |
| 2017 | 5,697 | -0.1% |
| 2016 | 5,701 | 0.8% |
| 2015 | 5,653 | 0.8% |
| 2014 | 5,606 | 1.6% |
| 2013 | 5,517 | 1.0% |
| 2012 | 5,460 | 2.2% |
| 2011 | 5,344 | 1.3% |
| 2010 | 5,273 | - |
Race / Ethnicity in Loudon
| Race | Loudon | TN | USA |
|---|---|---|---|
| White | 77.8% | 73.8% | 60.7% |
| African American | 1.5% | 16.6% | 12.3% |
| American Indian | 0.0% | 0.2% | 0.7% |
| Asian | 0.0% | 1.7% | 5.5% |
| Hawaiian | 0.0% | 0.1% | 0.2% |
| Other | 0.0% | 0.2% | 0.2% |
| Two Or More | 2.3% | 2.0% | 2.4% |
| Hispanic | 18.3% | 5.4% | 18.0% |
Gender in Loudon
| Gender | Loudon | TN | USA |
|---|---|---|---|
| Female | 49.7% | 51.2% | 50.8% |
| Male | 50.3% | 48.8% | 49.2% |
Highest level of educational attainment in Loudon for adults over 25
| Education | Loudon | TN | USA |
|---|---|---|---|
| < 9th Grade | 15.0% | 5.0% | 6.0% |
| 9-12th Grade | 15.0% | 8.0% | 7.0% |
| High School / GED | 35.0% | 32.0% | 27.0% |
| Some College | 17.0% | 21.0% | 20.0% |
| Associate's Degree | 5.0% | 7.0% | 8.0% |
| Bachelor's Degree | 8.0% | 17.0% | 20.0% |
| Master's Degree | 4.0% | 7.0% | 9.0% |
| Professional Degree | 0.0% | 2.0% | 2.0% |
| Doctorate Degree | 1.0% | 1.0% | 1.0% |
Household Income For Loudon, Tennessee
| Income | Loudon | TN | USA |
|---|---|---|---|
| Less than $10,000 | 6.0% | 6.9% | 6.0% |
| $10,000 to $14,999 | 7.7% | 5.2% | 4.3% |
| $15,000 to $24,999 | 20.8% | 10.6% | 8.9% |
| $25,000 to $34,999 | 8.3% | 10.4% | 8.9% |
| $35,000 to $49,999 | 13.3% | 14.0% | 12.3% |
| $50,000 to $74,999 | 20.9% | 18.3% | 17.2% |
| $75,000 to $99,999 | 7.0% | 12.4% | 12.7% |
| $100,000 to $149,999 | 12.2% | 12.8% | 15.1% |
| $150,000 to $199,999 | 2.2% | 4.7% | 6.8% |
| $200,000 or more | 1.6% | 4.8% | 7.7% |


