Sparta, TN
Quality of Life, Demographics, And Statistics
HomeSnacks is reader-supported. When you click through real estate links on our site, we earn an affiliate commission. Learn more.
Sparta, Tennessee Info Snack
Table Of Contents
Population
4,937
Unemployment
11.5%
Poverty
13.5%
Median Home
$93,900
Median Income
$33,750
Median Rent
$640
Sparta SnackAbility
4
Overall SnackAbility
Overall SnackAbility
Jobs
3/10
Housing
4
Affordability
6
Diversity
7
Safety
6
Amenities
6
Education
4
Commute
9.5
Sparta, TN Crime Report
213
Total Crimes
Total Crimes
4,297.0
Total Crimes / 100k People
Total Crimes / 100k People
73.50%
Above National Average
Above National Average
| Statistic | Count Raw |
Sparta / 100k People |
Tennessee / 100k People |
National / 100k People |
|---|---|---|---|---|
| Total Crimes Per 100K | 213 | 4,297.0 | 3,247.8 | 2,476.7 |
| Violent Crime | 6 | 121.0 | 595.2 | 366.7 |
| Murder | 0 | 0.0 | 7.3 | 5.0 |
| Robbery | 0 | 0.0 | 90.1 | 81.6 |
| Aggravated Assault | 5 | 100.9 | 456.7 | 250.2 |
| Property Crime | 207 | 4,175.9 | 2,652.6 | 2,109.9 |
| Burglary | 24 | 484.2 | 437.4 | 340.5 |
| Larceny | 158 | 3,187.4 | 1,934.4 | 1,549.5 |
| Car Theft | 25 | 504.3 | 280.9 | 219.9 |
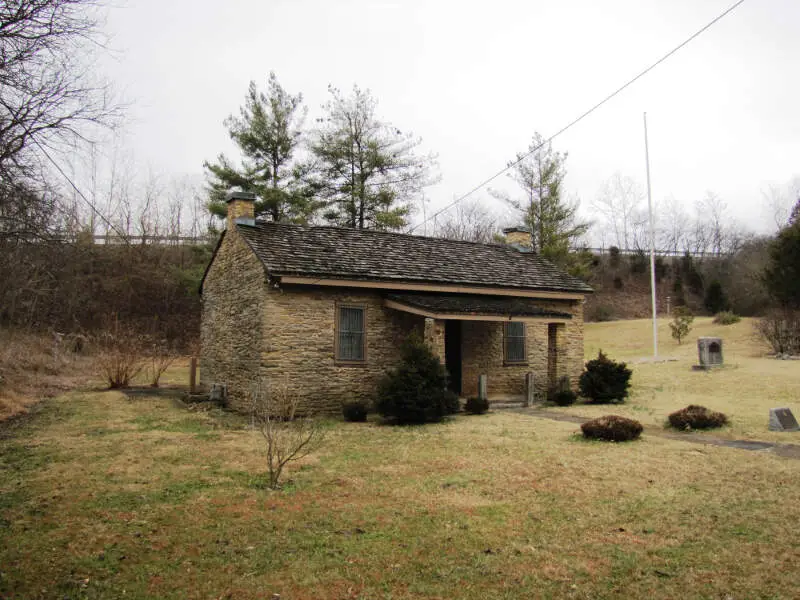
Sparta, TN Photos

Source: Wikipedia User Brian Stansberry | CC BY 3.0
Source: Wikipedia User Brian Stansberry | GFDL
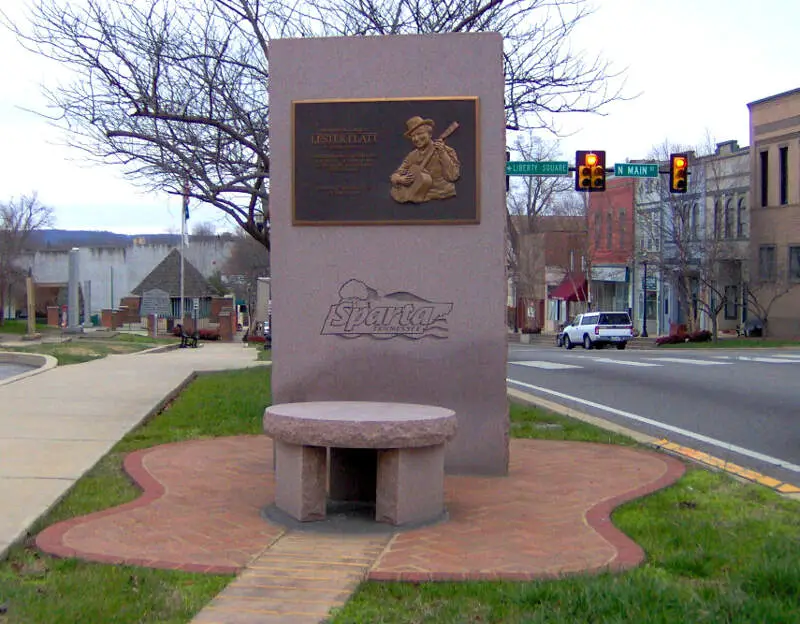
Source: Wikipedia User Brian Stansberry (photogr | GFDL
Rankings for Sparta in Tennessee


Map Of Sparta, TN
Best Places Around Sparta
1
Spring, TX
Population 60,976
2
Soddy-Daisy, TN
Population 13,398
3
Fairfield Glade, TN
Population 8,985
4
Manchester, TN
Population 10,721
5
Cookeville, TN
Population 33,454
6
Dayton, TN
Population 7,344
7
McMinnville, TN
Population 13,695
8
Rockwood, TN
Population 5,423
9
Crossville, TN
Population 11,545
Population over time in Sparta
| Year | Population | % Change |
|---|---|---|
| 2019 | 4,937 | -0.1% |
| 2018 | 4,940 | -0.2% |
| 2017 | 4,952 | -2.2% |
| 2016 | 5,063 | -0.2% |
| 2015 | 5,074 | 0.8% |
| 2014 | 5,036 | 0.5% |
| 2013 | 5,009 | 1.0% |
| 2012 | 4,961 | 0.8% |
| 2011 | 4,920 | 0.6% |
| 2010 | 4,891 | - |
Race / Ethnicity in Sparta
| Race | Sparta | TN | USA |
|---|---|---|---|
| White | 83.8% | 73.8% | 60.7% |
| African American | 6.5% | 16.6% | 12.3% |
| American Indian | 0.0% | 0.2% | 0.7% |
| Asian | 0.8% | 1.7% | 5.5% |
| Hawaiian | 0.0% | 0.1% | 0.2% |
| Other | 0.0% | 0.2% | 0.2% |
| Two Or More | 2.3% | 2.0% | 2.4% |
| Hispanic | 6.6% | 5.4% | 18.0% |
Gender in Sparta
| Gender | Sparta | TN | USA |
|---|---|---|---|
| Female | 49.8% | 51.2% | 50.8% |
| Male | 50.2% | 48.8% | 49.2% |
Highest level of educational attainment in Sparta for adults over 25
| Education | Sparta | TN | USA |
|---|---|---|---|
| < 9th Grade | 10.0% | 5.0% | 6.0% |
| 9-12th Grade | 10.0% | 8.0% | 7.0% |
| High School / GED | 42.0% | 32.0% | 27.0% |
| Some College | 21.0% | 21.0% | 20.0% |
| Associate's Degree | 5.0% | 7.0% | 8.0% |
| Bachelor's Degree | 7.0% | 17.0% | 20.0% |
| Master's Degree | 3.0% | 7.0% | 9.0% |
| Professional Degree | 1.0% | 2.0% | 2.0% |
| Doctorate Degree | 1.0% | 1.0% | 1.0% |
Household Income For Sparta, Tennessee
| Income | Sparta | TN | USA |
|---|---|---|---|
| Less than $10,000 | 8.8% | 6.9% | 6.0% |
| $10,000 to $14,999 | 10.3% | 5.2% | 4.3% |
| $15,000 to $24,999 | 20.0% | 10.6% | 8.9% |
| $25,000 to $34,999 | 12.1% | 10.4% | 8.9% |
| $35,000 to $49,999 | 21.2% | 14.0% | 12.3% |
| $50,000 to $74,999 | 15.4% | 18.3% | 17.2% |
| $75,000 to $99,999 | 7.8% | 12.4% | 12.7% |
| $100,000 to $149,999 | 3.3% | 12.8% | 15.1% |
| $150,000 to $199,999 | 1.0% | 4.7% | 6.8% |
| $200,000 or more | 0.0% | 4.8% | 7.7% |


