Newport, VT
Quality of Life, Demographics, And Statistics
HomeSnacks is reader-supported. When you click through real estate links on our site, we earn an affiliate commission. Learn more.
Newport, Vermont Info Snack
Table Of Contents
Population
4,305
Unemployment
5.8%
Poverty
15.4%
Median Home
$117,700
Median Income
$37,500
Median Rent
$812
Newport SnackAbility
5
Overall SnackAbility
Overall SnackAbility
Jobs
5/10
Housing
6
Affordability
5
Diversity
5
Safety
4
Amenities
6
Education
6
Commute
8.5
Newport, VT Crime Report
121
Total Crimes
Total Crimes
2,870.0
Total Crimes / 100k People
Total Crimes / 100k People
15.88%
Above National Average
Above National Average
| Statistic | Count Raw |
Newport / 100k People |
Vermont / 100k People |
National / 100k People |
|---|---|---|---|---|
| Total Crimes Per 100K | 121 | 2,870.0 | 1,626.6 | 2,476.7 |
| Violent Crime | 34 | 806.5 | 202.2 | 366.7 |
| Murder | 0 | 0.0 | 1.8 | 5.0 |
| Robbery | 0 | 0.0 | 11.4 | 81.6 |
| Aggravated Assault | 26 | 616.7 | 144.6 | 250.2 |
| Property Crime | 87 | 2,063.6 | 1,424.4 | 2,109.9 |
| Burglary | 15 | 355.8 | 204.3 | 340.5 |
| Larceny | 69 | 1,636.6 | 1,172.3 | 1,549.5 |
| Car Theft | 3 | 71.2 | 47.8 | 219.9 |
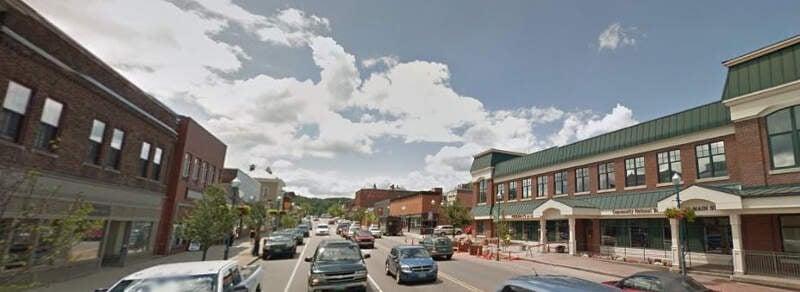
Newport, VT Photos
Source: Wikipedia User |
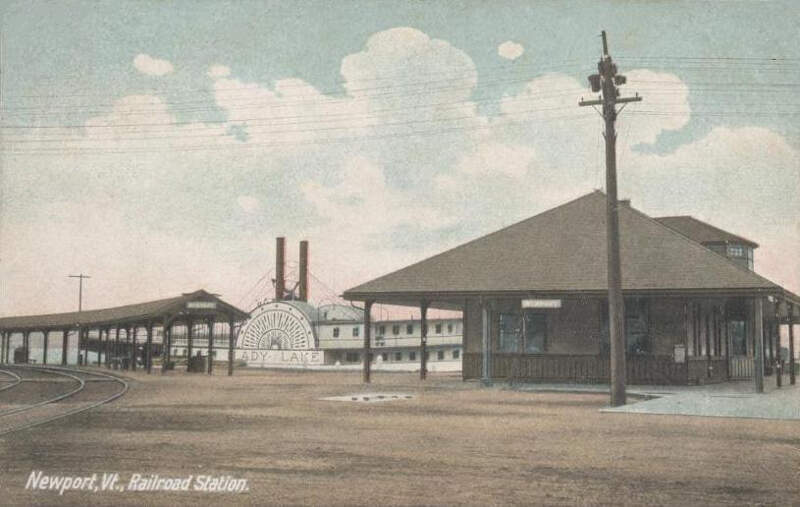
Source: Public Domain

Source: Public Domain
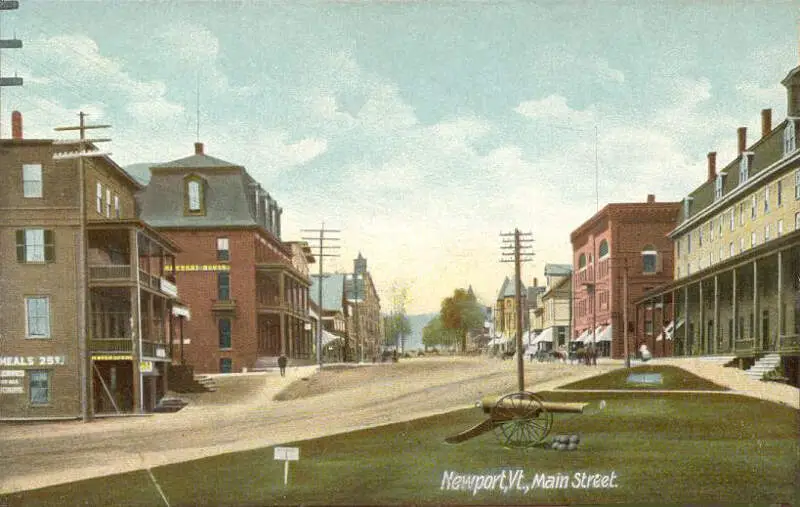
Source: Public Domain

Source: Wikipedia User Mfwills | CC BY-SA 3.0

Source: Public Domain
Rankings for Newport in Vermont


Map Of Newport, VT
Best Places Around Newport
1
East Montpelier, VT
Population 45
2
Stowe, VT
Population 201
3
Montpelier, VT
Population 7,477
4
Hardwick, VT
Population 1,079
5
St. Johnsbury, VT
Population 5,865
6
St. Albans, VT
Population 6,804
Population over time in Newport
| Year | Population | % Change |
|---|---|---|
| 2019 | 4,305 | -0.6% |
| 2018 | 4,331 | -0.9% |
| 2017 | 4,372 | -1.2% |
| 2016 | 4,426 | -1.5% |
| 2015 | 4,493 | -0.9% |
| 2014 | 4,535 | -0.6% |
| 2013 | 4,564 | -0.8% |
| 2012 | 4,601 | -1.1% |
| 2011 | 4,654 | -1.0% |
| 2010 | 4,701 | - |
Race / Ethnicity in Newport
| Race | Newport | VT | USA |
|---|---|---|---|
| White | 92.9% | 92.8% | 60.7% |
| African American | 0.7% | 1.3% | 12.3% |
| American Indian | 0.2% | 0.3% | 0.7% |
| Asian | 0.0% | 1.7% | 5.5% |
| Hawaiian | 0.2% | 0.0% | 0.2% |
| Other | 0.0% | 0.1% | 0.2% |
| Two Or More | 4.2% | 1.9% | 2.4% |
| Hispanic | 1.7% | 1.9% | 18.0% |
Gender in Newport
| Gender | Newport | VT | USA |
|---|---|---|---|
| Female | 45.6% | 50.7% | 50.8% |
| Male | 54.4% | 49.3% | 49.2% |
Highest level of educational attainment in Newport for adults over 25
| Education | Newport | VT | USA |
|---|---|---|---|
| < 9th Grade | 5.0% | 2.0% | 6.0% |
| 9-12th Grade | 10.0% | 5.0% | 7.0% |
| High School / GED | 41.0% | 29.0% | 27.0% |
| Some College | 19.0% | 17.0% | 20.0% |
| Associate's Degree | 8.0% | 9.0% | 8.0% |
| Bachelor's Degree | 11.0% | 22.0% | 20.0% |
| Master's Degree | 5.0% | 11.0% | 9.0% |
| Professional Degree | 1.0% | 3.0% | 2.0% |
| Doctorate Degree | 0.0% | 2.0% | 1.0% |
Household Income For Newport, Vermont
| Income | Newport | VT | USA |
|---|---|---|---|
| Less than $10,000 | 9.1% | 4.8% | 6.0% |
| $10,000 to $14,999 | 12.5% | 5.0% | 4.3% |
| $15,000 to $24,999 | 12.8% | 9.1% | 8.9% |
| $25,000 to $34,999 | 13.5% | 9.1% | 8.9% |
| $35,000 to $49,999 | 9.9% | 12.2% | 12.3% |
| $50,000 to $74,999 | 19.8% | 18.7% | 17.2% |
| $75,000 to $99,999 | 7.9% | 14.0% | 12.7% |
| $100,000 to $149,999 | 9.7% | 16.0% | 15.1% |
| $150,000 to $199,999 | 0.9% | 5.6% | 6.8% |
| $200,000 or more | 3.9% | 5.5% | 7.7% |


