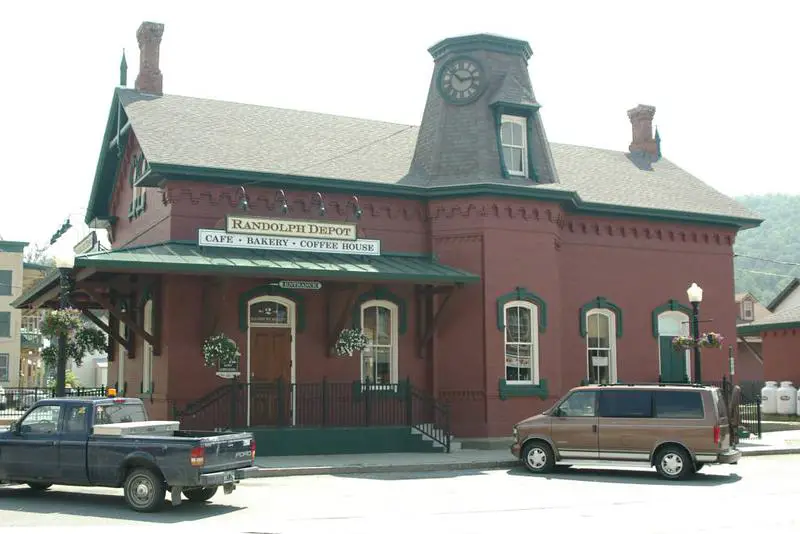
Randolph, VT
Quality of Life, Demographics, And Statistics
HomeSnacks is reader-supported. When you click through real estate links on our site, we earn an affiliate commission. Learn more.
Randolph, Vermont Info Snack
Table Of Contents
Population
2,158
Unemployment
8.3%
Poverty
16.3%
Median Home
$173,200
Median Income
$48,636
Median Rent
$770
Randolph SnackAbility
4
Overall SnackAbility
Overall SnackAbility
Jobs
5/10
Housing
7
Affordability
6
Diversity
3
Safety
N/A
Amenities
5
Education
8.5
Commute
7
Randolph, VT Photos
Rankings for Randolph in Vermont


Map Of Randolph, VT
Best Places Around Randolph
1
Ticonderoga, NY
Population 3,236
2
Ticonderoga, NY
Population 3,236
3
Hanover, NH
Population 8,508
4
Hartland, VT
Population 285
5
Norwich, VT
Population 592
6
Hinesburg, VT
Population 772
7
Shelburne, VT
Population 525
8
East Montpelier, VT
Population 45
9
Essex Junction, VT
Population 10,603
10
South Burlington, VT
Population 19,162
Population over time in Randolph
| Year | Population | % Change |
|---|---|---|
| 2019 | 2,158 | -3.0% |
| 2018 | 2,225 | 3.0% |
| 2017 | 2,160 | 5.4% |
| 2016 | 2,049 | -7.5% |
| 2015 | 2,214 | -6.2% |
| 2014 | 2,361 | 13.0% |
| 2013 | 2,090 | 22.7% |
| 2012 | 1,703 | -2.5% |
| 2011 | 1,747 | 1.1% |
| 2010 | 1,728 | - |
Race / Ethnicity in Randolph
| Race | Randolph | VT | USA |
|---|---|---|---|
| White | 97.5% | 92.8% | 60.7% |
| African American | 0.0% | 1.3% | 12.3% |
| American Indian | 0.0% | 0.3% | 0.7% |
| Asian | 0.0% | 1.7% | 5.5% |
| Hawaiian | 0.0% | 0.0% | 0.2% |
| Other | 0.0% | 0.1% | 0.2% |
| Two Or More | 1.4% | 1.9% | 2.4% |
| Hispanic | 1.1% | 1.9% | 18.0% |
Gender in Randolph
| Gender | Randolph | VT | USA |
|---|---|---|---|
| Female | 49.2% | 50.7% | 50.8% |
| Male | 50.8% | 49.3% | 49.2% |
Highest level of educational attainment in Randolph for adults over 25
| Education | Randolph | VT | USA |
|---|---|---|---|
| < 9th Grade | 1.0% | 2.0% | 6.0% |
| 9-12th Grade | 6.0% | 5.0% | 7.0% |
| High School / GED | 39.0% | 29.0% | 27.0% |
| Some College | 12.0% | 17.0% | 20.0% |
| Associate's Degree | 10.0% | 9.0% | 8.0% |
| Bachelor's Degree | 15.0% | 22.0% | 20.0% |
| Master's Degree | 15.0% | 11.0% | 9.0% |
| Professional Degree | 1.0% | 3.0% | 2.0% |
| Doctorate Degree | 1.0% | 2.0% | 1.0% |
Household Income For Randolph, Vermont
| Income | Randolph | VT | USA |
|---|---|---|---|
| Less than $10,000 | 11.5% | 4.8% | 6.0% |
| $10,000 to $14,999 | 6.6% | 5.0% | 4.3% |
| $15,000 to $24,999 | 8.2% | 9.1% | 8.9% |
| $25,000 to $34,999 | 6.4% | 9.1% | 8.9% |
| $35,000 to $49,999 | 18.0% | 12.2% | 12.3% |
| $50,000 to $74,999 | 18.4% | 18.7% | 17.2% |
| $75,000 to $99,999 | 13.0% | 14.0% | 12.7% |
| $100,000 to $149,999 | 11.4% | 16.0% | 15.1% |
| $150,000 to $199,999 | 6.5% | 5.6% | 6.8% |
| $200,000 or more | 0.0% | 5.5% | 7.7% |


