Connell, WA
Quality of Life, Demographics, And Statistics
HomeSnacks is reader-supported. When you click through real estate links on our site, we earn an affiliate commission. Learn more.
Connell, Washington Info Snack
Table Of Contents
Population
5,518
Unemployment
5.3%
Poverty
14.2%
Median Home
$161,400
Median Income
$71,831
Median Rent
$951
Connell SnackAbility
6
Overall SnackAbility
Overall SnackAbility
Jobs
8/10
Housing
8
Affordability
8.5
Diversity
9.5
Safety
8.5
Amenities
6
Education
3
Commute
9.5
Connell, WA Crime Report
27
Total Crimes
Total Crimes
471.6
Total Crimes / 100k People
Total Crimes / 100k People
-79.90%
Below National Average
Below National Average
| Statistic | Count Raw |
Connell / 100k People |
Washington / 100k People |
National / 100k People |
|---|---|---|---|---|
| Total Crimes Per 100K | 27 | 471.6 | 3,026.1 | 2,346.0 |
| Violent Crime | 6 | 104.8 | 293.7 | 387.8 |
| Murder | 0 | 0.0 | 3.9 | 6.5 |
| Robbery | 0 | 0.0 | 67.4 | 73.9 |
| Aggravated Assault | 3 | 52.4 | 187.6 | 279.7 |
| Property Crime | 21 | 366.8 | 2,732.4 | 1,958.2 |
| Burglary | 5 | 87.3 | 522.1 | 314.2 |
| Larceny | 14 | 244.5 | 1,854.2 | 1,398.0 |
| Car Theft | 2 | 34.9 | 356.1 | 246.0 |
Connell, WA Cost Of Living
93
Connell's Overall Cost Of Living
Connell's Overall Cost Of Living
0.9x
Lower Than The National Average
Lower Than The National Average
| Living Expense | Connell | Washington | National Average | |
|---|---|---|---|---|
| Overall | 93 | 119 | 100 | |
| Services | 100 | 112 | 100 | |
| Groceries | 104 | 110 | 100 | |
| Health | 125 | 122 | 100 | |
| Housing | 66 | 136 | 100 | |
| Transportation | 112 | 123 | 100 | |
| Utilities | 96 | 91 | 100 | |
Connell, WA Photos
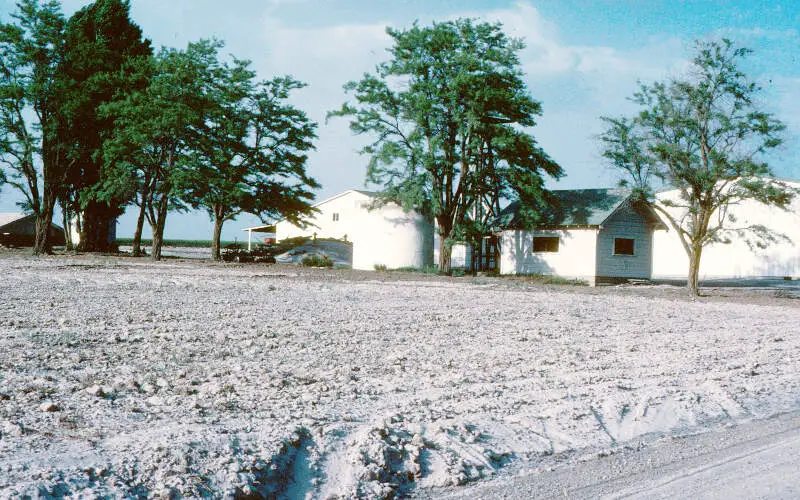
Source: Public Domain
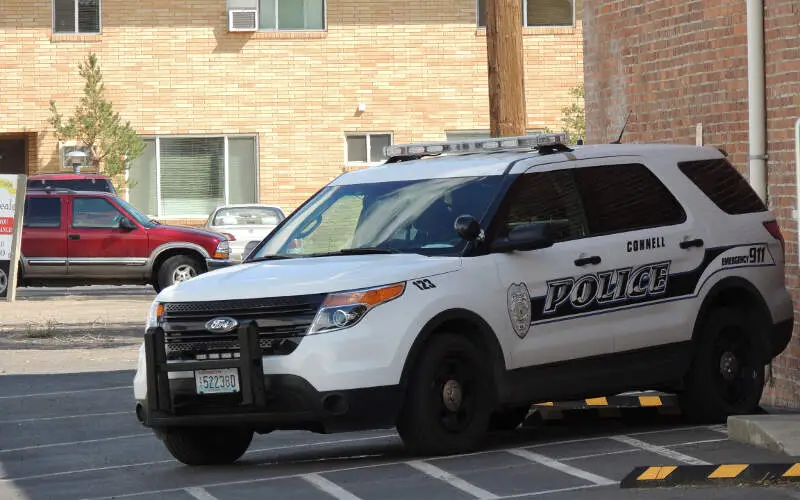
Source: Wikipedia User Richard Bauer | CC BY 2.0
Rankings for Connell in Washington


Map Of Connell, WA
Best Places Around Connell
1
Moses Lake North, WA
Population 4,664
2
Walla Walla, WA
Population 32,951
3
Moses Lake, WA
Population 23,442
4
Finley, WA
Population 5,858
5
Kennewick, WA
Population 82,633
6
Pasco, WA
Population 74,266
7
Richland, WA
Population 57,353
8
West Richland, WA
Population 14,842
9
Othello, WA
Population 8,241
10
College Place, WA
Population 9,311
Population over time in Connell
| Year | Population | % Change |
|---|---|---|
| 2020 | 5,518 | 0.7% |
| 2019 | 5,482 | 0.6% |
| 2018 | 5,447 | 0.6% |
| 2017 | 5,414 | 1.0% |
| 2016 | 5,359 | 4.5% |
| 2015 | 5,130 | 8.0% |
| 2014 | 4,751 | 9.1% |
| 2013 | 4,356 | 10.1% |
| 2012 | 3,956 | 10.8% |
| 2011 | 3,570 | - |
Race / Ethnicity in Connell
| Race | Connell | WA | USA |
|---|---|---|---|
| White | 49.4% | 67.5% | 60.1% |
| African American | 5.1% | 3.7% | 12.2% |
| American Indian | 1.0% | 1.0% | 0.6% |
| Asian | 7.0% | 8.7% | 5.6% |
| Hawaiian | 0.3% | 0.7% | 0.2% |
| Other | 0.5% | 0.3% | 0.3% |
| Two Or More | 1.5% | 5.2% | 2.8% |
| Hispanic | 35.2% | 12.9% | 18.2% |
Gender in Connell
| Gender | Connell | WA | USA |
|---|---|---|---|
| Female | 34.9% | 50.0% | 50.8% |
| Male | 65.1% | 50.0% | 49.2% |
Highest level of educational attainment in Connell for adults over 25
| Education | Connell | WA | USA |
|---|---|---|---|
| < 9th Grade | 15.0% | 3.0% | 5.0% |
| 9-12th Grade | 9.0% | 5.0% | 7.0% |
| High School / GED | 26.0% | 22.0% | 27.0% |
| Some College | 32.0% | 23.0% | 20.0% |
| Associate's Degree | 12.0% | 10.0% | 9.0% |
| Bachelor's Degree | 5.0% | 23.0% | 20.0% |
| Master's Degree | 1.0% | 10.0% | 9.0% |
| Professional Degree | 0.0% | 2.0% | 2.0% |
| Doctorate Degree | 0.0% | 2.0% | 1.0% |
Household Income For Connell, Washington
| Income | Connell | WA | USA |
|---|---|---|---|
| Less than $10,000 | 3.5% | 4.4% | 5.8% |
| $10,000 to $14,999 | 3.0% | 3.1% | 4.1% |
| $15,000 to $24,999 | 15.1% | 6.5% | 8.5% |
| $25,000 to $34,999 | 2.5% | 6.9% | 8.6% |
| $35,000 to $49,999 | 12.4% | 10.8% | 12.0% |
| $50,000 to $74,999 | 23.1% | 17.1% | 17.2% |
| $75,000 to $99,999 | 20.6% | 13.6% | 12.8% |
| $100,000 to $149,999 | 14.2% | 18.2% | 15.6% |
| $150,000 to $199,999 | 5.6% | 8.9% | 7.1% |
| $200,000 or more | 0.0% | 10.5% | 8.3% |


