Everett, WA
Quality of Life, Demographics, And Statistics
Living In Everett, Washington Summary
Life in Everett research summary. HomeSnacks has been researching the quality of life in Everett over the past eight years using Census data, FBI crime data, cost of living data, and other primary sources. Based on the most recently available data, we found the following about life in Everett:
The population in Everett is 110,438.
The median home value in Everett is $394,900.
The median income in Everett is $71,357.
The cost of living in Everett is 125 which is 1.2x higher than the national average.
The median rent in Everett is $1,426.
The unemployment rate in Everett is 5.0%.
The poverty rate in Everett is 11.0%.
Table Of Contents
Everett SnackAbility
7
Overall SnackAbility
Overall SnackAbility
Jobs
8/10
Housing
9
Affordability
4
Diversity
9
Safety
5
Amenities
9.5
Education
6
Commute
6
Everett, WA Crime Report
5,306
Total Crimes
Total Crimes
4,793.4
Total Crimes / 100k People
Total Crimes / 100k People
106.24%
Above National Average
Above National Average
| Statistic | Count Raw |
Everett / 100k People |
Washington / 100k People |
National / 100k People |
|---|---|---|---|---|
| Total Crimes Per 100K | 5,306 | 4,793.4 | 3,026.1 | 2,324.2 |
| Violent Crime | 490 | 442.7 | 293.7 | 369.8 |
| Murder | 12 | 10.8 | 3.9 | 6.3 |
| Robbery | 110 | 99.4 | 67.4 | 66.1 |
| Aggravated Assault | 314 | 283.7 | 187.6 | 268.2 |
| Property Crime | 4,816 | 4,350.7 | 2,732.4 | 1,954.4 |
| Burglary | 738 | 666.7 | 522.1 | 269.8 |
| Larceny | 3,082 | 2,784.3 | 1,854.2 | 1,401.9 |
| Car Theft | 996 | 899.8 | 356.1 | 282.7 |
Everett, WA Cost Of Living
125
Everett's Overall Cost Of Living
Everett's Overall Cost Of Living
1.2x
Higher Than The National Average
Higher Than The National Average
| Living Expense | Everett | Washington | National Average | |
|---|---|---|---|---|
| Overall | 125 | 115 | 100 | |
| Services | 128 | 112 | 100 | |
| Groceries | 129 | 109 | 100 | |
| Health | 127 | 119 | 100 | |
| Housing | 124 | 129 | 100 | |
| Transportation | 139 | 116 | 100 | |
| Utilities | 110 | 90 | 100 | |
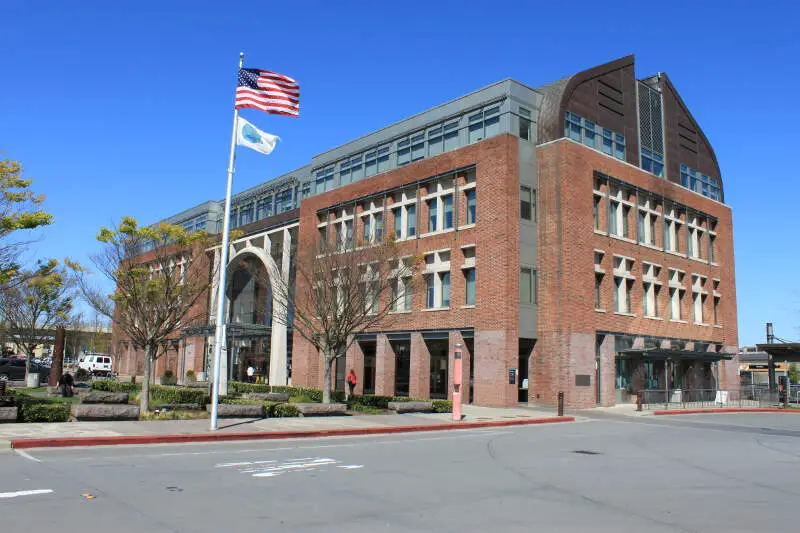
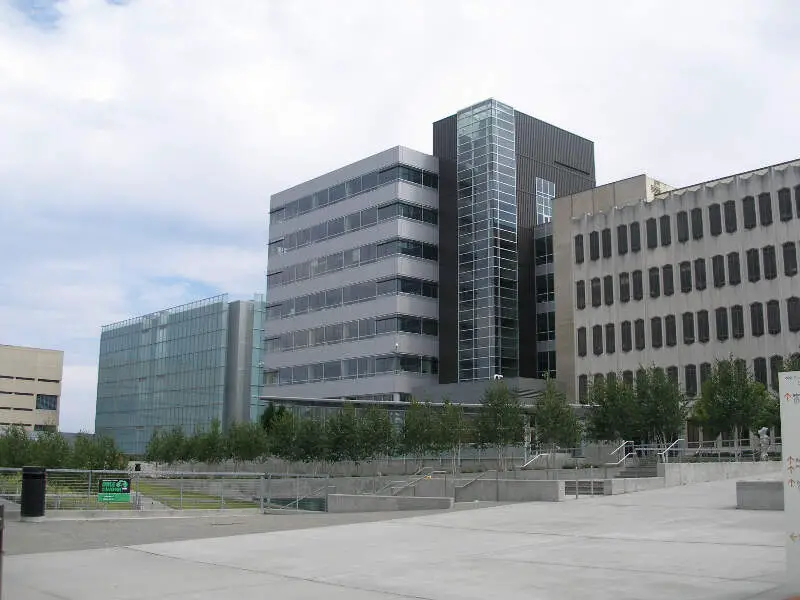
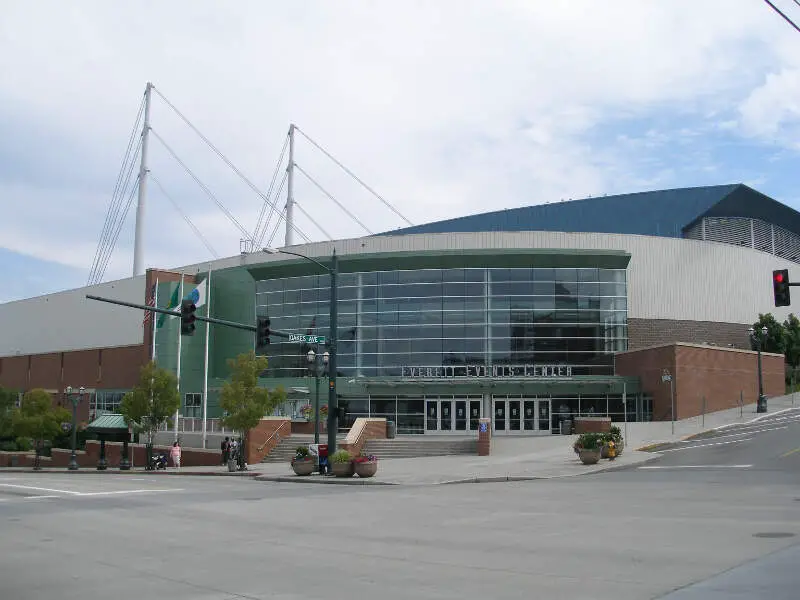
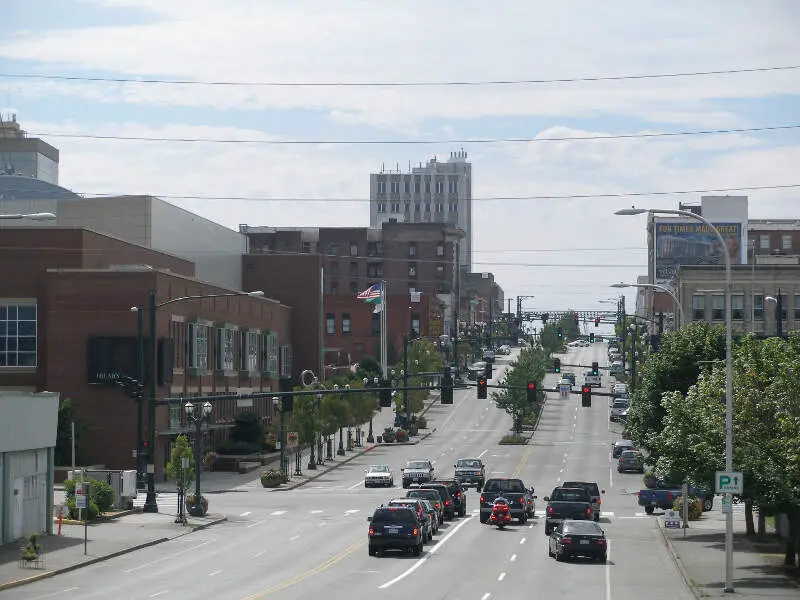
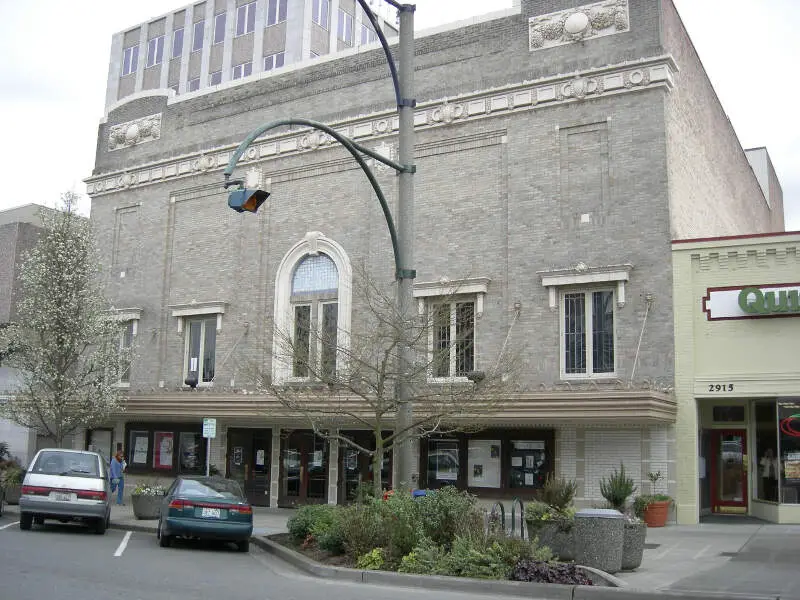
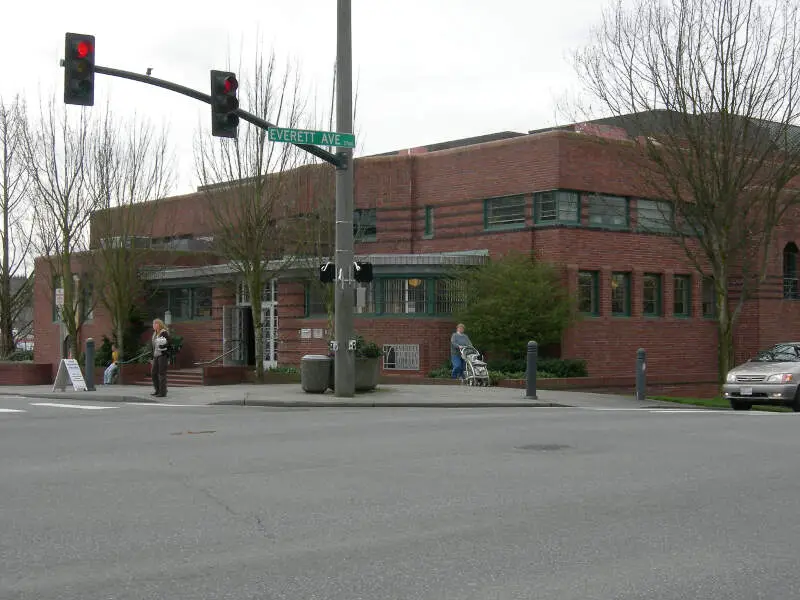
Everett, WA Photos
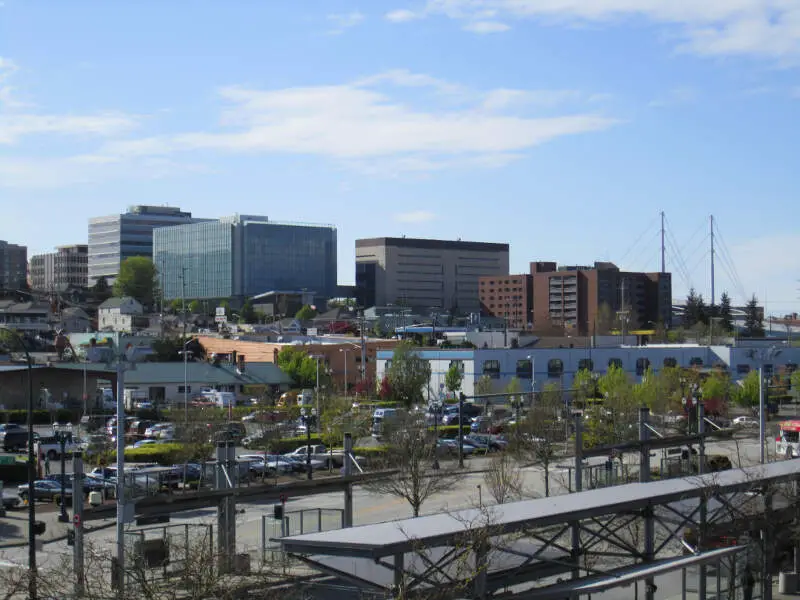
Source: Wikipedia User SounderBruce | GFDL
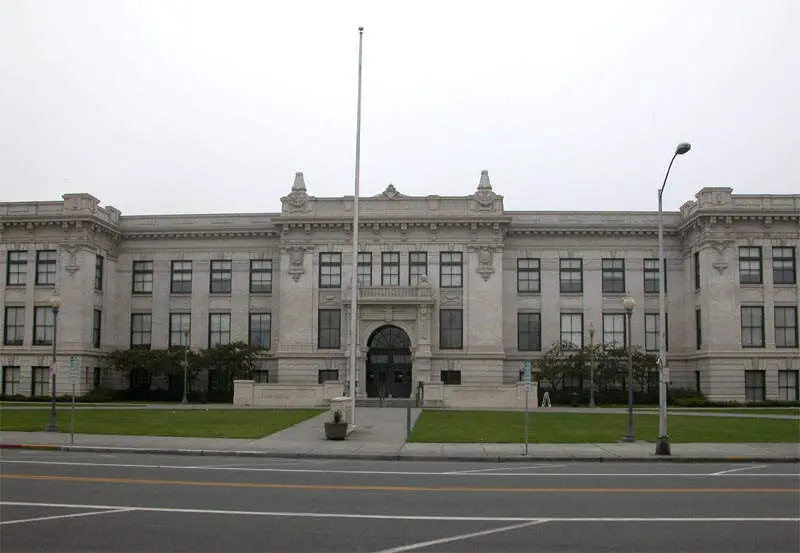
Source: Wikipedia User SounderBruce | CC BY-SA 2.0
Source: Wikipedia User Emersb | GFDL
Source: Wikipedia User Emersb | GFDL
Source: Wikipedia User Emersb | GFDL
Source: Wikipedia User Joe Mabel | GFDL
Source: Wikipedia User Joe Mabel | GFDL
Source: Wikipedia User Joe Mabel | GFDL
Rankings for Everett in Washington


Map Of Everett, WA
Best Places Around Everett
1
Snohomish, WA
Population 10,091
2
Arlington, WA
Population 19,832
3
Lake Stickney, WA
Population 14,733
4
Lake Stevens, WA
Population 35,135
5
Monroe, WA
Population 19,879
6
Lynnwood, WA
Population 38,812
7
North Lynnwood, WA
Population 24,562
8
Woodinville, WA
Population 13,247
9
Woods Creek, WA
Population 6,226
10
Martha Lake, WA
Population 22,251
Population over time in Everett
| Year | Population | % Change |
|---|---|---|
| 2021 | 110,840 | 1.7% |
| 2020 | 108,941 | 1.3% |
| 2019 | 107,560 | 0.9% |
| 2018 | 106,580 | 0.8% |
| 2017 | 105,685 | 0.9% |
| 2016 | 104,708 | 0.8% |
| 2015 | 103,918 | 0.8% |
| 2014 | 103,135 | 0.6% |
| 2013 | 102,569 | 0.9% |
| 2012 | 101,667 | - |
Race / Ethnicity in Everett
| Race | Everett | WA | USA |
|---|---|---|---|
| White | 60.5% | 66.5% | 59.4% |
| African American | 6.4% | 3.7% | 12.2% |
| American Indian | 0.4% | 0.9% | 0.6% |
| Asian | 9.3% | 8.9% | 5.6% |
| Hawaiian | 0.6% | 0.6% | 0.2% |
| Other | 0.3% | 0.4% | 0.4% |
| Two Or More | 5.9% | 5.8% | 3.2% |
| Hispanic | 16.5% | 13.2% | 18.4% |
Gender in Everett
| Gender | Everett | WA | USA |
|---|---|---|---|
| Female | 48.2% | 49.7% | 50.5% |
| Male | 51.8% | 50.3% | 49.5% |
Highest level of educational attainment in Everett for adults over 25
| Education | Everett | WA | USA |
|---|---|---|---|
| < 9th Grade | 4.0% | 3.0% | 5.0% |
| 9-12th Grade | 7.0% | 5.0% | 6.0% |
| High School / GED | 27.0% | 22.0% | 26.0% |
| Some College | 26.0% | 23.0% | 20.0% |
| Associate's Degree | 10.0% | 10.0% | 9.0% |
| Bachelor's Degree | 18.0% | 23.0% | 21.0% |
| Master's Degree | 6.0% | 10.0% | 9.0% |
| Professional Degree | 1.0% | 2.0% | 2.0% |
| Doctorate Degree | 1.0% | 2.0% | 2.0% |
Household Income For Everett, Washington
| Income | Everett | WA | USA |
|---|---|---|---|
| Less than $10,000 | 4.4% | 4.2% | 5.5% |
| $10,000 to $14,999 | 4.2% | 2.9% | 3.9% |
| $15,000 to $24,999 | 6.2% | 5.9% | 7.8% |
| $25,000 to $34,999 | 7.8% | 6.4% | 8.2% |
| $35,000 to $49,999 | 10.5% | 10.1% | 11.4% |
| $50,000 to $74,999 | 19.4% | 16.3% | 16.8% |
| $75,000 to $99,999 | 16.2% | 13.4% | 12.8% |
| $100,000 to $149,999 | 17.8% | 18.7% | 16.3% |
| $150,000 to $199,999 | 8.2% | 9.8% | 7.8% |
| $200,000 or more | 5.4% | 12.4% | 9.5% |


