Vancouver, WA
Quality of Life, Demographics, And Statistics
Living In Vancouver, Washington Summary
Life in Vancouver research summary. HomeSnacks has been researching the quality of life in Vancouver over the past eight years using Census data, FBI crime data, cost of living data, and other primary sources. Based on the most recently available data, we found the following about life in Vancouver:
The population in Vancouver is 188,331.
The median home value in Vancouver is $343,900.
The median income in Vancouver is $67,462.
The cost of living in Vancouver is 116 which is 1.2x higher than the national average.
The median rent in Vancouver is $1,396.
The unemployment rate in Vancouver is 5.5%.
The poverty rate in Vancouver is 12.7%.
Table Of Contents
Vancouver SnackAbility
8
Overall SnackAbility
Overall SnackAbility
Jobs
8/10
Housing
8.5
Affordability
4
Diversity
8.5
Safety
4
Amenities
9.5
Education
8
Commute
7
Vancouver, WA Crime Report
12,006
Total Crimes
Total Crimes
6,211.9
Total Crimes / 100k People
Total Crimes / 100k People
167.27%
Above National Average
Above National Average
| Statistic | Count Raw |
Vancouver / 100k People |
Washington / 100k People |
National / 100k People |
|---|---|---|---|---|
| Total Crimes Per 100K | 12,006 | 6,211.9 | 3,026.1 | 2,324.2 |
| Violent Crime | 1,229 | 635.9 | 293.7 | 369.8 |
| Murder | 14 | 7.2 | 3.9 | 6.3 |
| Robbery | 293 | 151.6 | 67.4 | 66.1 |
| Aggravated Assault | 790 | 408.7 | 187.6 | 268.2 |
| Property Crime | 10,777 | 5,576.1 | 2,732.4 | 1,954.4 |
| Burglary | 1,351 | 699.0 | 522.1 | 269.8 |
| Larceny | 6,625 | 3,427.8 | 1,854.2 | 1,401.9 |
| Car Theft | 2,801 | 1,449.2 | 356.1 | 282.7 |
Vancouver, WA Cost Of Living
116
Vancouver's Overall Cost Of Living
Vancouver's Overall Cost Of Living
1.2x
Higher Than The National Average
Higher Than The National Average
| Living Expense | Vancouver | Washington | National Average | |
|---|---|---|---|---|
| Overall | 116 | 115 | 100 | |
| Services | 122 | 112 | 100 | |
| Groceries | 112 | 109 | 100 | |
| Health | 115 | 119 | 100 | |
| Housing | 113 | 129 | 100 | |
| Transportation | 130 | 116 | 100 | |
| Utilities | 87 | 90 | 100 | |
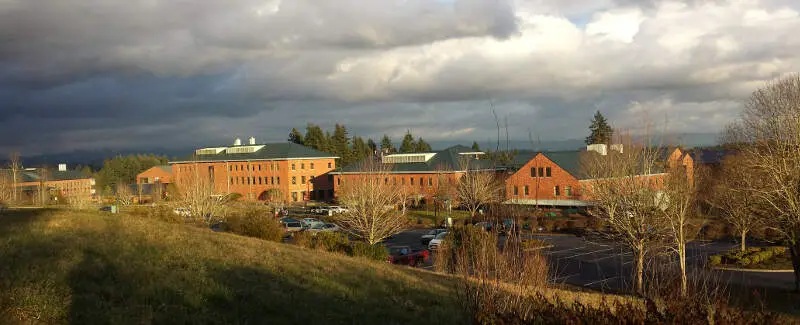
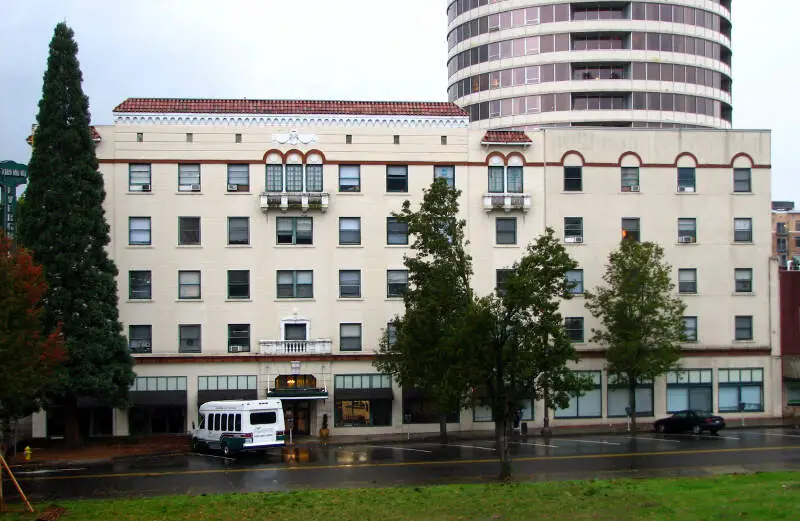
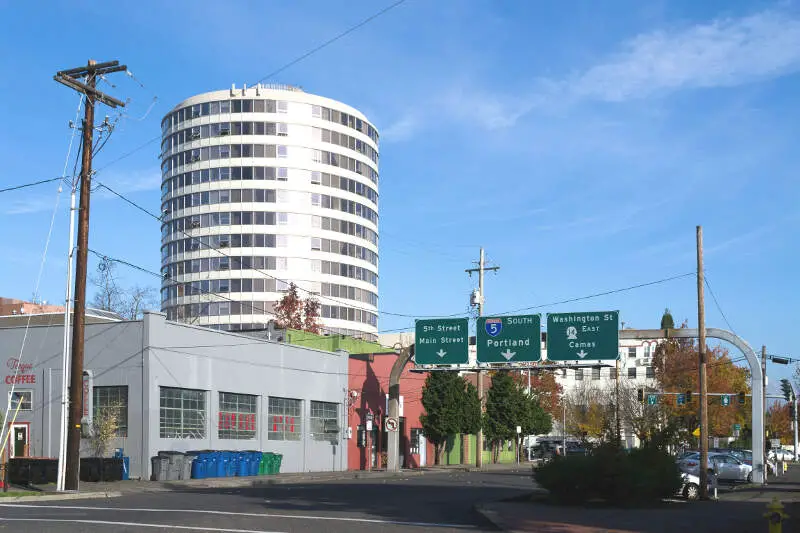
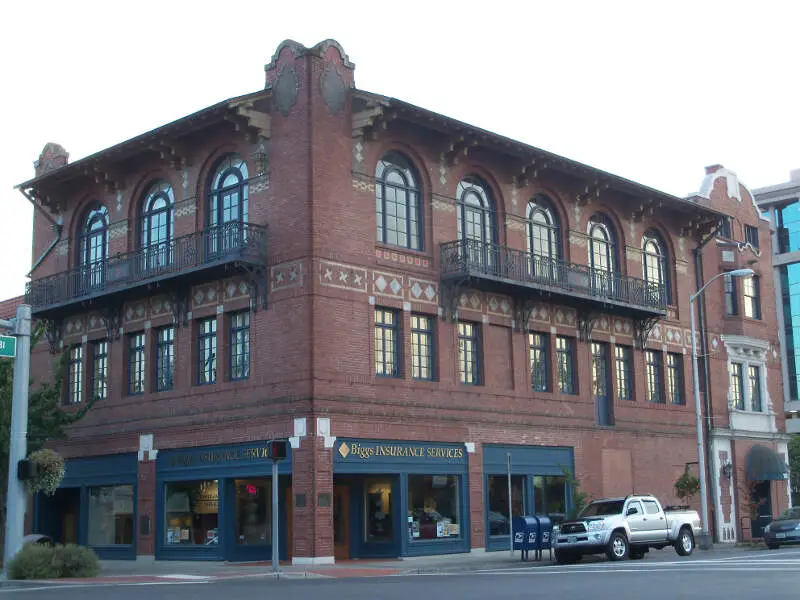
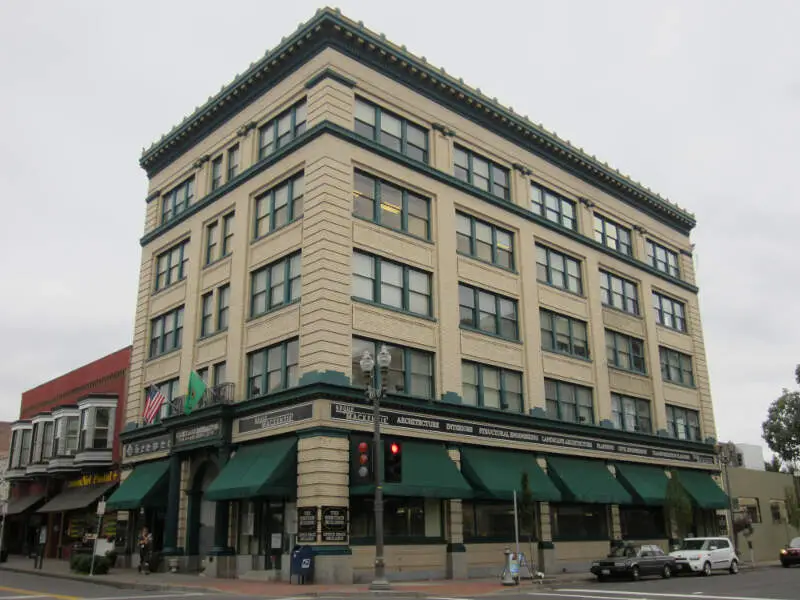
Vancouver, WA Photos
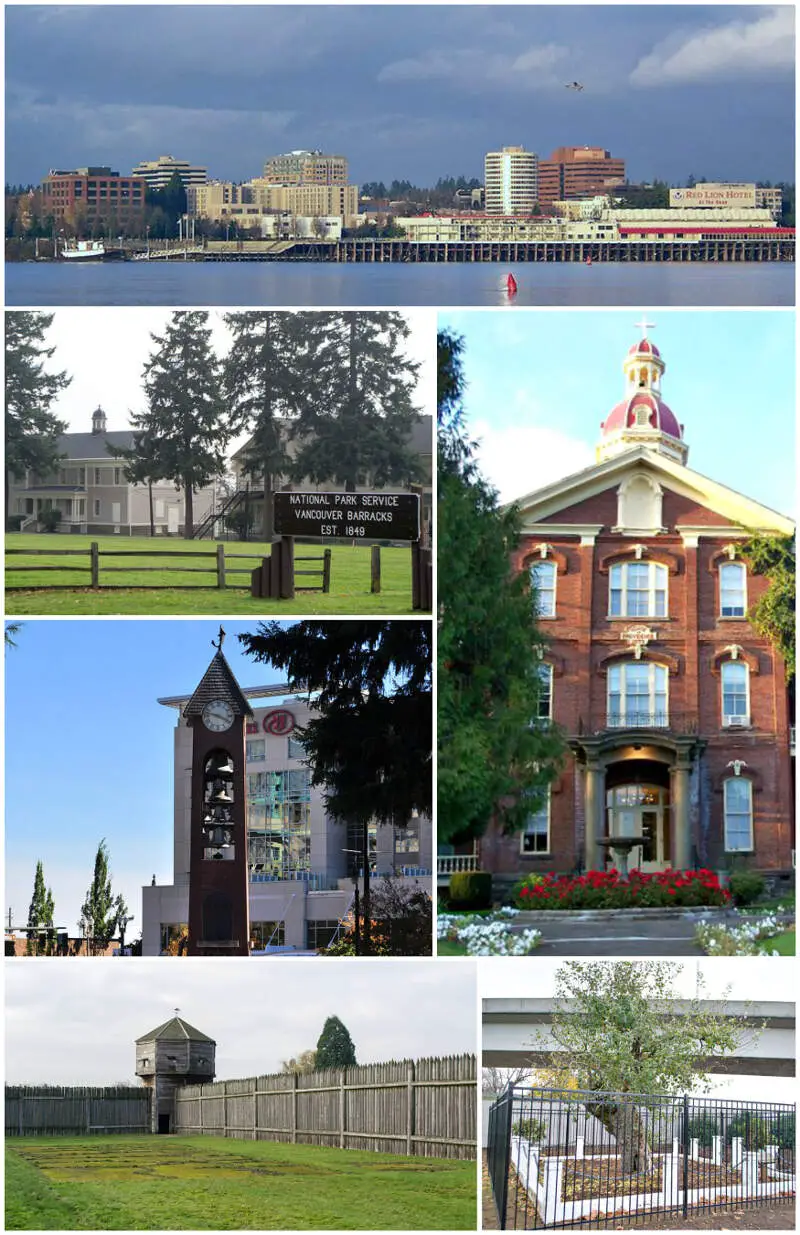
Source: Wikipedia User Drown Soda | CC BY-SA 4.0
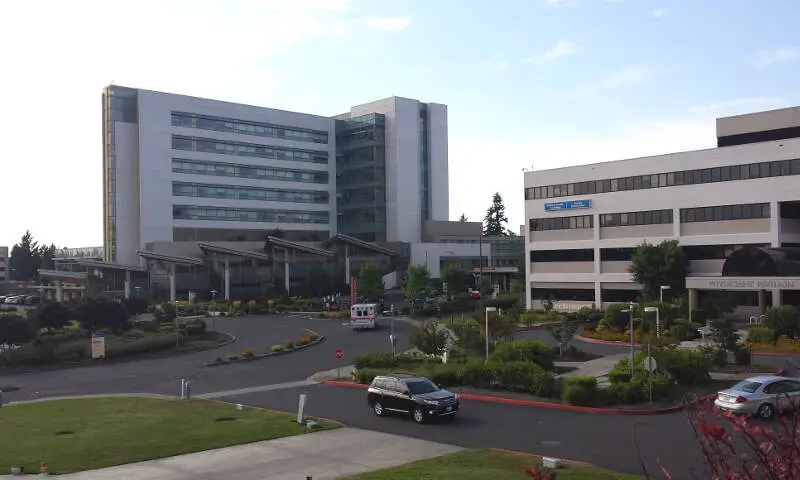
Source: Wikipedia User Rytyho usa | CC BY-SA 3.0
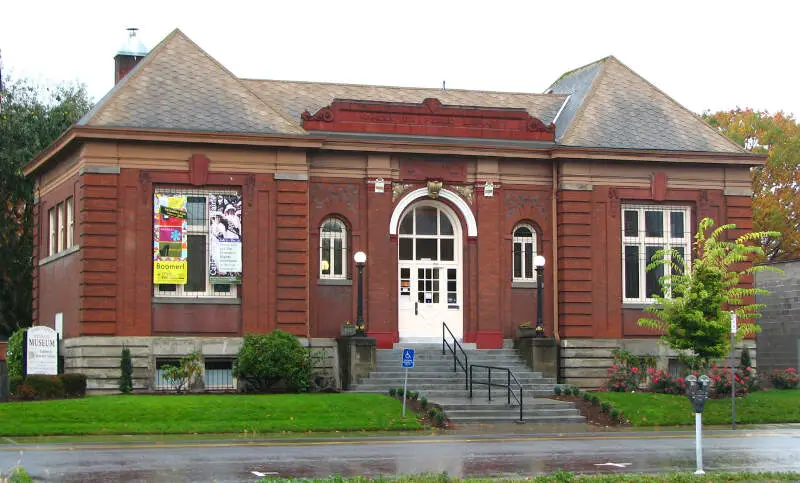
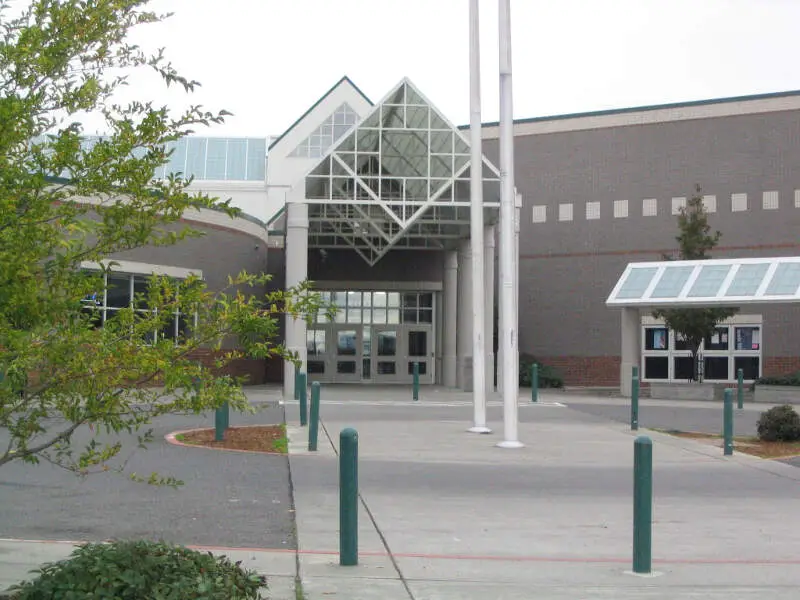
Source: Wikipedia User | PD
Source: Wikipedia User Rytyho usa | CC BY-SA 3.0
Source: Wikipedia User Ian Poellet | CC BY-SA 3.0
Source: Wikipedia User Visitor7 | CC BY-SA 3.0
Source: Wikipedia User I am a cat | CC BY-SA 3.0
Source: Wikipedia User Another Believer | CC BY-SA 3.0
Vancouver Articles

Rankings for Vancouver in Washington


Map Of Vancouver, WA
Best Places Around Vancouver
1
Washougal, WA
Population 16,664
2
Battle Ground, WA
Population 20,536
3
Hazel Dell, WA
Population 21,650
4
Camas, WA
Population 25,774
5
Mount Vista, WA
Population 9,924
6
Five Corners, WA
Population 20,428
7
Lake Oswego, OR
Population 40,390
8
West Linn, OR
Population 27,173
9
Orchards, WA
Population 28,371
Population over time in Vancouver
| Year | Population | % Change |
|---|---|---|
| 2021 | 182,792 | 2.5% |
| 2020 | 178,413 | 4.1% |
| 2019 | 171,393 | 0.8% |
| 2018 | 169,982 | 1.1% |
| 2017 | 168,050 | 1.5% |
| 2016 | 165,554 | 0.9% |
| 2015 | 164,111 | 0.9% |
| 2014 | 162,699 | 0.7% |
| 2013 | 161,606 | 0.9% |
| 2012 | 160,202 | - |
Race / Ethnicity in Vancouver
| Race | Vancouver | WA | USA |
|---|---|---|---|
| White | 69.0% | 66.5% | 59.4% |
| African American | 2.2% | 3.7% | 12.2% |
| American Indian | 0.4% | 0.9% | 0.6% |
| Asian | 5.4% | 8.9% | 5.6% |
| Hawaiian | 1.6% | 0.6% | 0.2% |
| Other | 0.3% | 0.4% | 0.4% |
| Two Or More | 6.5% | 5.8% | 3.2% |
| Hispanic | 14.7% | 13.2% | 18.4% |
Gender in Vancouver
| Gender | Vancouver | WA | USA |
|---|---|---|---|
| Female | 50.6% | 49.7% | 50.5% |
| Male | 49.4% | 50.3% | 49.5% |
Highest level of educational attainment in Vancouver for adults over 25
| Education | Vancouver | WA | USA |
|---|---|---|---|
| < 9th Grade | 2.0% | 3.0% | 5.0% |
| 9-12th Grade | 6.0% | 5.0% | 6.0% |
| High School / GED | 24.0% | 22.0% | 26.0% |
| Some College | 26.0% | 23.0% | 20.0% |
| Associate's Degree | 11.0% | 10.0% | 9.0% |
| Bachelor's Degree | 20.0% | 23.0% | 21.0% |
| Master's Degree | 8.0% | 10.0% | 9.0% |
| Professional Degree | 2.0% | 2.0% | 2.0% |
| Doctorate Degree | 1.0% | 2.0% | 2.0% |
Household Income For Vancouver, Washington
| Income | Vancouver | WA | USA |
|---|---|---|---|
| Less than $10,000 | 4.8% | 4.2% | 5.5% |
| $10,000 to $14,999 | 3.1% | 2.9% | 3.9% |
| $15,000 to $24,999 | 7.2% | 5.9% | 7.8% |
| $25,000 to $34,999 | 7.0% | 6.4% | 8.2% |
| $35,000 to $49,999 | 12.2% | 10.1% | 11.4% |
| $50,000 to $74,999 | 21.2% | 16.3% | 16.8% |
| $75,000 to $99,999 | 14.7% | 13.4% | 12.8% |
| $100,000 to $149,999 | 17.5% | 18.7% | 16.3% |
| $150,000 to $199,999 | 6.3% | 9.8% | 7.8% |
| $200,000 or more | 6.1% | 12.4% | 9.5% |


