Grafton, WV
Quality of Life, Demographics, And Statistics
HomeSnacks is reader-supported. When you click through real estate links on our site, we earn an affiliate commission. Learn more.
Grafton, West Virginia Info Snack
Table Of Contents
Population
5,035
Unemployment
15.5%
Poverty
27.5%
Median Home
$77,500
Median Income
$34,555
Median Rent
$553
Grafton SnackAbility
4
Overall SnackAbility
Overall SnackAbility
Jobs
3/10
Housing
3
Affordability
8
Diversity
5
Safety
8.5
Amenities
8
Education
7
Commute
8.5
Grafton, WV Cost Of Living
80
Grafton's Overall Cost Of Living
Grafton's Overall Cost Of Living
0.8x
Lower Than The National Average
Lower Than The National Average
| Living Expense | Grafton | West Virginia | National Average | |
|---|---|---|---|---|
| Overall | 80 | 88 | 100 | |
| Services | 103 | 106 | 100 | |
| Groceries | 99 | 100 | 100 | |
| Health | 91 | 87 | 100 | |
| Housing | 42 | 63 | 100 | |
| Transportation | 88 | 89 | 100 | |
| Utilities | 90 | 90 | 100 | |
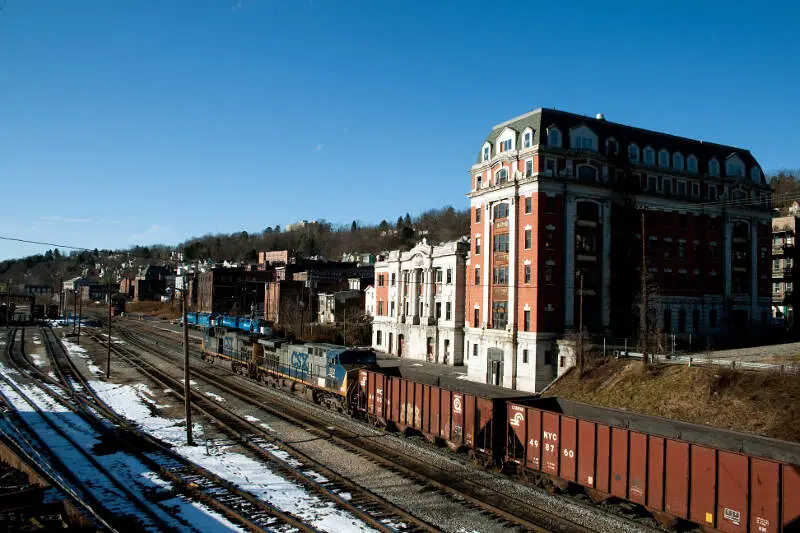
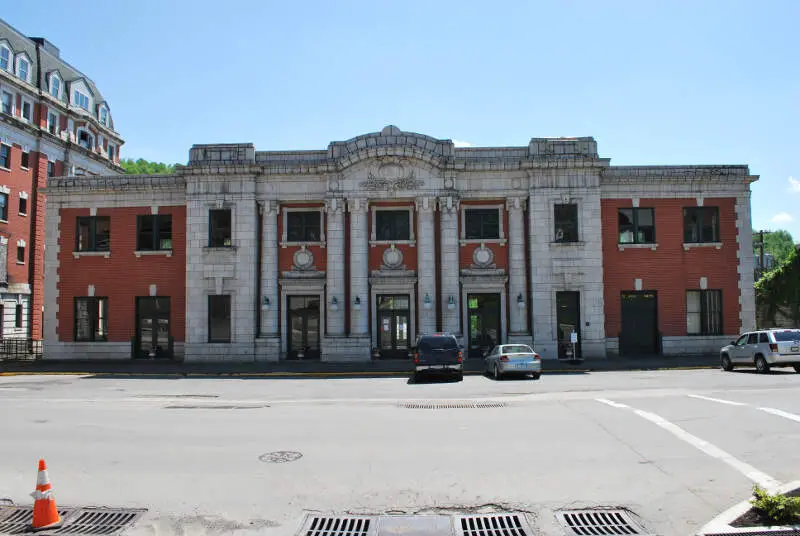
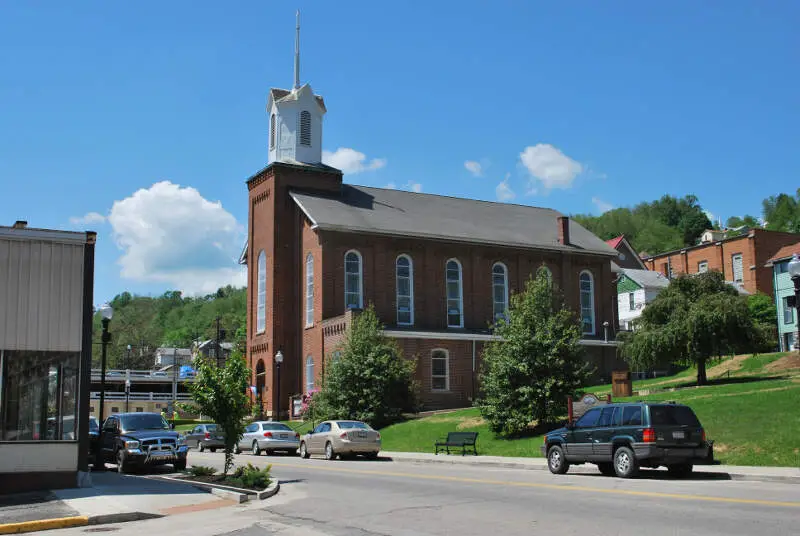
Grafton, WV Photos

Rankings for Grafton in West Virginia


Map Of Grafton, WV
Best Places Around Grafton
1
Centerville, SC
Population 6,816
2
Bridgeport, WV
Population 8,675
3
Brookhaven, WV
Population 6,293
4
Buckhannon, WV
Population 5,473
5
Cheat Lake, WV
Population 9,559
6
Fairmont, WV
Population 18,443
7
Uniontown, PA
Population 9,740
8
New Martinsville, WV
Population 5,123
9
Morgantown, WV
Population 30,953
10
Clarksburg, WV
Population 15,743
Population over time in Grafton
| Year | Population | % Change |
|---|---|---|
| 2020 | 5,035 | -1.1% |
| 2019 | 5,091 | -0.5% |
| 2018 | 5,118 | -0.7% |
| 2017 | 5,156 | -0.3% |
| 2016 | 5,173 | -0.1% |
| 2015 | 5,179 | -0.0% |
| 2014 | 5,180 | -0.2% |
| 2013 | 5,191 | -0.3% |
| 2012 | 5,205 | -0.1% |
| 2011 | 5,212 | - |
Race / Ethnicity in Grafton
| Race | Grafton | WV | USA |
|---|---|---|---|
| White | 92.3% | 91.5% | 60.1% |
| African American | 0.1% | 3.5% | 12.2% |
| American Indian | 0.0% | 0.2% | 0.6% |
| Asian | 0.5% | 0.8% | 5.6% |
| Hawaiian | 0.0% | 0.0% | 0.2% |
| Other | 1.7% | 0.2% | 0.3% |
| Two Or More | 4.6% | 2.2% | 2.8% |
| Hispanic | 0.9% | 1.6% | 18.2% |
Gender in Grafton
| Gender | Grafton | WV | USA |
|---|---|---|---|
| Female | 53.6% | 50.6% | 50.8% |
| Male | 46.4% | 49.4% | 49.2% |
Highest level of educational attainment in Grafton for adults over 25
| Education | Grafton | WV | USA |
|---|---|---|---|
| < 9th Grade | 1.0% | 4.0% | 5.0% |
| 9-12th Grade | 8.0% | 8.0% | 7.0% |
| High School / GED | 45.0% | 40.0% | 27.0% |
| Some College | 18.0% | 19.0% | 20.0% |
| Associate's Degree | 10.0% | 8.0% | 9.0% |
| Bachelor's Degree | 14.0% | 13.0% | 20.0% |
| Master's Degree | 3.0% | 6.0% | 9.0% |
| Professional Degree | 1.0% | 1.0% | 2.0% |
| Doctorate Degree | 0.0% | 1.0% | 1.0% |
Household Income For Grafton, West Virginia
| Income | Grafton | WV | USA |
|---|---|---|---|
| Less than $10,000 | 11.3% | 8.5% | 5.8% |
| $10,000 to $14,999 | 3.3% | 5.9% | 4.1% |
| $15,000 to $24,999 | 10.8% | 12.3% | 8.5% |
| $25,000 to $34,999 | 26.5% | 10.8% | 8.6% |
| $35,000 to $49,999 | 10.9% | 14.2% | 12.0% |
| $50,000 to $74,999 | 23.6% | 17.9% | 17.2% |
| $75,000 to $99,999 | 7.1% | 11.6% | 12.8% |
| $100,000 to $149,999 | 6.5% | 11.9% | 15.6% |
| $150,000 to $199,999 | 0.0% | 3.9% | 7.1% |
| $200,000 or more | 0.0% | 3.1% | 8.3% |


