Worland, WY
Quality of Life, Demographics, And Statistics
HomeSnacks is reader-supported. When you click through real estate links on our site, we earn an affiliate commission. Learn more.
Worland, Wyoming Info Snack
Table Of Contents
Population
5,112
Unemployment
5.6%
Poverty
13.9%
Median Home
$152,000
Median Income
$54,928
Median Rent
$610
Worland SnackAbility
7
Overall SnackAbility
Overall SnackAbility
Jobs
6/10
Housing
5
Affordability
8.5
Diversity
8
Safety
8.5
Amenities
8
Education
7
Commute
10
Worland, WY Crime Report
35
Total Crimes
Total Crimes
703.5
Total Crimes / 100k People
Total Crimes / 100k People
-70.01%
Below National Average
Below National Average
| Statistic | Count Raw |
Worland / 100k People |
Wyoming / 100k People |
National / 100k People |
|---|---|---|---|---|
| Total Crimes Per 100K | 35 | 703.5 | 1,844.8 | 2,346.0 |
| Violent Crime | 6 | 120.6 | 234.2 | 387.8 |
| Murder | 0 | 0.0 | 3.1 | 6.5 |
| Robbery | 0 | 0.0 | 11.3 | 73.9 |
| Aggravated Assault | 5 | 100.5 | 162.6 | 279.7 |
| Property Crime | 29 | 582.9 | 1,610.6 | 1,958.2 |
| Burglary | 4 | 80.4 | 210.4 | 314.2 |
| Larceny | 23 | 462.3 | 1,234.7 | 1,398.0 |
| Car Theft | 2 | 40.2 | 165.5 | 246.0 |
Worland, WY Cost Of Living
91
Worland's Overall Cost Of Living
Worland's Overall Cost Of Living
0.9x
Lower Than The National Average
Lower Than The National Average
| Living Expense | Worland | Wyoming | National Average | |
|---|---|---|---|---|
| Overall | 91 | 100 | 100 | |
| Services | 109 | 104 | 100 | |
| Groceries | 101 | 101 | 100 | |
| Health | 99 | 98 | 100 | |
| Housing | 63 | 101 | 100 | |
| Transportation | 85 | 88 | 100 | |
| Utilities | 90 | 89 | 100 | |
Worland, WY Photos
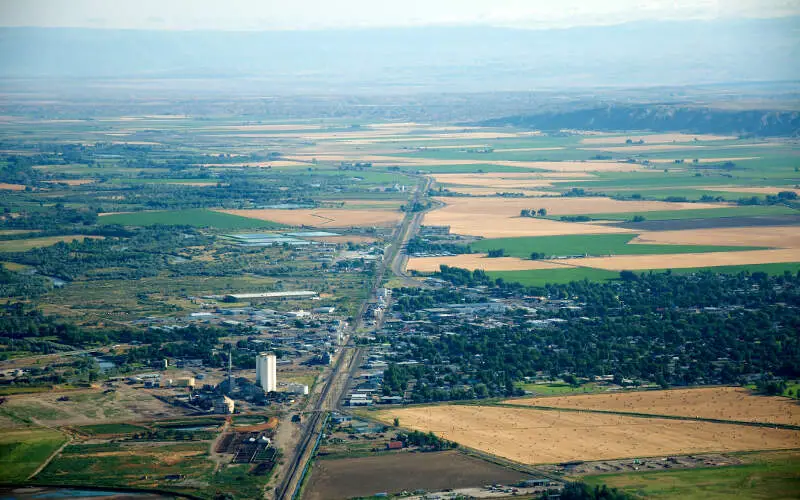
Source: Wikipedia User Sam Beebe | CC BY 2.0
Rankings for Worland in Wyoming


Map Of Worland, WY
Best Places Around Worland
1
Basin, WY
Population 1,421
2
Greybull, WY
Population 2,145
3
Thermopolis, WY
Population 2,747
Population over time in Worland
| Year | Population | % Change |
|---|---|---|
| 2020 | 5,112 | -2.4% |
| 2019 | 5,236 | -1.4% |
| 2018 | 5,310 | -1.4% |
| 2017 | 5,383 | -0.6% |
| 2016 | 5,416 | -0.5% |
| 2015 | 5,445 | -0.1% |
| 2014 | 5,453 | 0.5% |
| 2013 | 5,426 | 0.6% |
| 2012 | 5,391 | 1.3% |
| 2011 | 5,323 | - |
Race / Ethnicity in Worland
| Race | Worland | WY | USA |
|---|---|---|---|
| White | 74.7% | 83.6% | 60.1% |
| African American | 0.0% | 0.8% | 12.2% |
| American Indian | 0.5% | 2.0% | 0.6% |
| Asian | 0.0% | 0.8% | 5.6% |
| Hawaiian | 0.0% | 0.1% | 0.2% |
| Other | 0.6% | 0.1% | 0.3% |
| Two Or More | 4.0% | 2.5% | 2.8% |
| Hispanic | 20.2% | 10.1% | 18.2% |
Gender in Worland
| Gender | Worland | WY | USA |
|---|---|---|---|
| Female | 48.1% | 49.0% | 50.8% |
| Male | 51.9% | 51.0% | 49.2% |
Highest level of educational attainment in Worland for adults over 25
| Education | Worland | WY | USA |
|---|---|---|---|
| < 9th Grade | 2.0% | 1.0% | 5.0% |
| 9-12th Grade | 8.0% | 5.0% | 7.0% |
| High School / GED | 27.0% | 29.0% | 27.0% |
| Some College | 29.0% | 25.0% | 20.0% |
| Associate's Degree | 12.0% | 11.0% | 9.0% |
| Bachelor's Degree | 15.0% | 18.0% | 20.0% |
| Master's Degree | 5.0% | 8.0% | 9.0% |
| Professional Degree | 2.0% | 2.0% | 2.0% |
| Doctorate Degree | 0.0% | 1.0% | 1.0% |
Household Income For Worland, Wyoming
| Income | Worland | WY | USA |
|---|---|---|---|
| Less than $10,000 | 4.8% | 5.2% | 5.8% |
| $10,000 to $14,999 | 6.3% | 3.7% | 4.1% |
| $15,000 to $24,999 | 5.6% | 8.1% | 8.5% |
| $25,000 to $34,999 | 12.2% | 8.8% | 8.6% |
| $35,000 to $49,999 | 15.5% | 12.3% | 12.0% |
| $50,000 to $74,999 | 23.0% | 18.2% | 17.2% |
| $75,000 to $99,999 | 15.9% | 14.9% | 12.8% |
| $100,000 to $149,999 | 14.3% | 17.5% | 15.6% |
| $150,000 to $199,999 | 1.0% | 6.2% | 7.1% |
| $200,000 or more | 1.5% | 5.0% | 8.3% |


