
Folks in Kansas City have a lot to celebrate. And not just because the Chiefs won the Super Bowl last season. It’s among the most diverse places in Missouri, a cultural hub that represents the best of the American midwest.
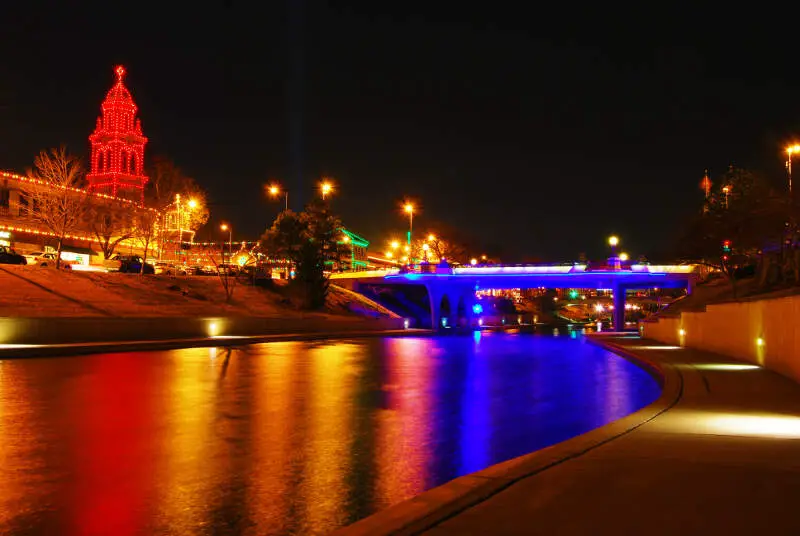
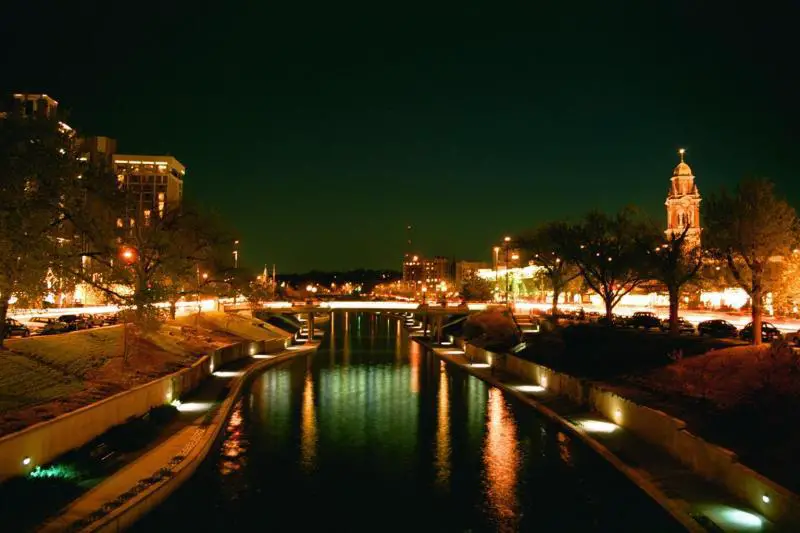
Kansas City boasts more fountains than Rome, so it’s not hard to see how it got the nickname the City of Fountains. But a nickname like “the City of Boulevards” would be equally apt, seeing as KC has more boulevards than any city in the world, except Paris. What’s clear is that Kansas City is one snazzy city that puts a premium on aesthetic quality. I mean, Swope Park is twice the size of NYC’s Central Park, so you know locals value gorgeous outdoor spaces.
And KC isn’t just a treat for the eyes. With a storied tradition of promoting jazz musicians from the 1920s up until the present day, your ears are likely to be treated to some seriously tasty tunes as well. Arts and culture are valued almost as highly as what is possibly Kansas City’s greatest pride: mouthwatering barbecue.
All right, that’s enough on how awesome Kansas City is, but can we be a bit more specific? Where can we find the best neighborhoods, complete with line-out-the-door BBQ joints, the hippest jazz venues, and the most majestic fountains? Well, it seems as though Kansas City’s southside enjoys an advantage over the city’s northern end. We came to that conclusion by looking at the statistics that translate into a high quality of life: high incomes, a high-quality market for both jobs and housing, low crime, and of course, plenty of entertaining things to do and see.
Don’t get spooked by the high home prices in Armour Fields; there are loads of great neighborhoods in Kansas City that don’t have such a high price tag. For example, taking a five-minute drive southeast of Armour Fields will bring you to Tower Homes, where homes are less than half the price. Or if you want a nice combination of high incomes and affordable home prices, Armour Hills might be just the ticket.
Pull up some BBQ ribs, throw on some Louis Armstrong, and get ready to start living like a Kansas City Royal, because we’re visiting KC’s best neighborhoods.
Table Of Contents: Top Ten | Methodology | Summary | Table
These are Kansas City’s cream of the crop neighborhoods — the ones with solid employment numbers, low crime, and great housing options. And, of course, a surplus of fun things to do that reflect what makes Kansas City such a great place to live. In any case, they’re miles away (in quality) from Kansas City’s worst neighborhoods.
So, what neighborhood came in as the absolute best in Kansas City for 2024? According to the data, Armour Hills is the best neighborhood to live in Kansas City.
Is your favorite fountain, BBQ joint, or jazz club in a different neighborhood than one featured on the list above? Check out the complete list of Kansas City neighborhood rankings down below to see how your neighborhood fared.
For more Missouri reading, check out:
- Best Places To Live In Missouri
- Cheapest Places To Live In Missouri
- Most Dangerous Cities in Missouri
The 10 Best Neighborhoods To Live In Kansas City

Population: 2,130
Median Home Value: $308,700 (Seventh best)
Median Income: $124,347 (best)
More on Armour Hills: Data | Real Estate
Population: 2,747
Median Home Value: $414,133 (Third best)
Median Income: $75,496 (15th best)
More on South Plaza: Data | Real Estate
Population: 800
Median Home Value: $281,400 (Tenth best)
Median Income: $103,164 (Fourth best)
More on Westwood: Data | Real Estate
Population: 2,247
Median Home Value: $438,500 (Second best)
Median Income: $76,806 (13th best)
More on River Market: Data | Real Estate
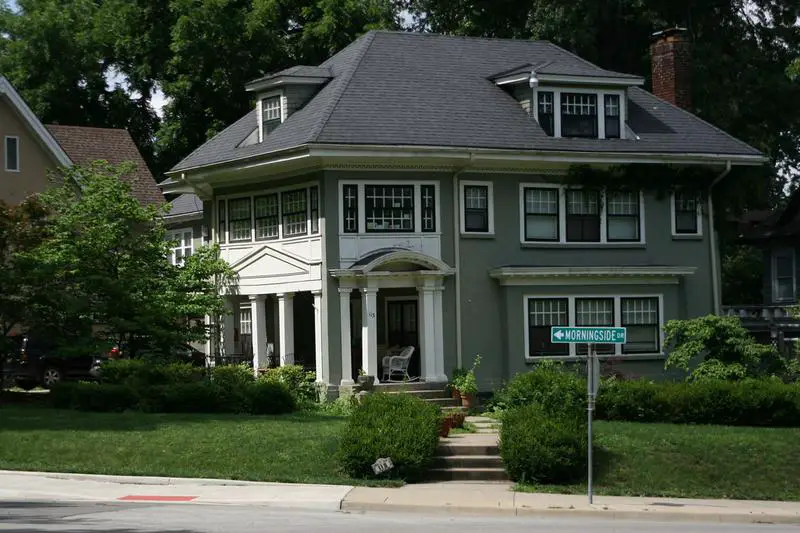
Population: 1,534
Median Home Value: $317,250 (Sixth best)
Median Income: $115,357 (Second best)
More on Morningside: Data | Real Estate
Population: 2,577
Median Home Value: $213,267 (24th best)
Median Income: $80,602 (11th best)
More on Ward Parkway: Data | Real Estate
Population: 1,990
Median Home Value: $278,450 (11th best)
Median Income: $69,637 (23rd best)
More on Longfellow: Data | Real Estate
Population: 3,765
Median Home Value: $281,675 (Ninth best)
Median Income: $65,231 (28th best)
More on Volker: Data | Real Estate
Population: 4,278
Median Home Value: $211,660 (25th best)
Median Income: $71,537 (20th best)
More on West Plaza: Data | Real Estate
Population: 4,461
Median Home Value: $273,525 (12th best)
Median Income: $71,579 (19th best)
More on Western 49-63: Data | Real Estate
Methodology: How We Determined The Best Kansas City, MO Neighborhoods In 2024
To rank the best neighborhoods in Kansas City, we had to determine what criteria define “best” and then apply Saturday Night Science to it.
Using FBI crime, Census, and extrapolated BLS data, we arrived at the following set of criteria:
- High incomes
- Low unemployment rates
- Low crime
- High home prices
- High population densities (A proxy for things to do)
We then ranked each neighborhood with scores from 1 to 123 in each category, where 1 was the best.
Next, we averaged the rankings for each neighborhood to create a best neighborhood index.
And finally, we crowned the neighborhood with the lowest best neighborhood index, the “Best City Neighborhood In Kansas City.” We’re lookin’ at you, Armour Hills.
Read on below to learn more about what it’s like to live in the best places Kansas City, Missouri has to offer. Or skip to the end to see the list of all the neighborhoods in the city, from best to worst.
We updated this article for 2024. This report is our tenth time ranking the best neighborhoods to live in Kansas City.
Summary: Putting A Bow On Our Analysis Of The Best Neighborhoods In Kansas City
If you’re measuring the neighborhoods in Kansas City where crime is low and everyone wants to live, this is an accurate list.
The best neighborhoods in Kansas City are Armour Hills, South Plaza, Westwood, River Market, Morningside, Ward Parkway, Longfellow, Volker, West Plaza, and Western 49-63.
As mentioned earlier, the neighborhoods in Kansas City aren’t all good. South Blue Valley takes the title of the worst neighborhood to live in Kansas City.
The worst neighborhoods in Kansas City are South Blue Valley, Eastwood Hills West, Blue Valley Industrial, Sheffield, and Marlborough East.
We ranked the neighborhoods from best to worst in the chart below.
For more Missouri reading, check out:
Best Neighborhoods To Live In Kansas City For 2024 Detailed Data
| Rank | Neighborhood | Population | Home Value | Median Income |
|---|---|---|---|---|
| 1 | Armour Hills | 2,130 | $308,700 | $124,347 |
| 2 | South Plaza | 2,747 | $414,133 | $75,496 |
| 3 | Westwood | 800 | $281,400 | $103,164 |
| 4 | River Market | 2,247 | $438,500 | $76,806 |
| 5 | Morningside | 1,534 | $317,250 | $115,357 |
| 6 | Ward Parkway | 2,577 | $213,267 | $80,602 |
| 7 | Longfellow | 1,990 | $278,450 | $69,637 |
| 8 | Volker | 3,765 | $281,675 | $65,231 |
| 9 | West Plaza | 4,278 | $211,660 | $71,537 |
| 10 | Western 49-63 | 4,461 | $273,525 | $71,579 |
| 11 | Tower Homes | 5,669 | $176,600 | $78,097 |
| 12 | Oak Meyer Gardens | 1,513 | $259,400 | $51,154 |
| 13 | Country Lane Estates | 2,053 | $229,300 | $48,938 |
| 14 | Royal Oaks | 1,622 | $177,900 | $61,198 |
| 15 | West Waldo | 1,414 | $180,700 | $67,534 |
| 16 | Plaza Westport | 1,252 | $271,150 | $86,275 |
| 17 | Unity Ridge | 1,150 | $333,300 | $93,542 |
| 18 | Central Business District-Downtown | 4,364 | $191,233 | $52,423 |
| 19 | Red Ridge South | 2,970 | $227,900 | $46,227 |
| 20 | Central Hyde Park | 1,789 | $335,650 | $103,888 |
| 21 | Crown Center | 1,455 | $244,133 | $74,465 |
| 22 | Blue Vue Hills | 2,047 | $172,200 | $70,125 |
| 23 | White Oak | 2,802 | $112,000 | $58,733 |
| 24 | Mission Lake | 3,585 | $185,800 | $73,739 |
| 25 | Faireway Hills | 2,342 | $128,200 | $74,063 |
| 26 | Ward Parkway Plaza | 472 | $173,600 | $54,063 |
| 27 | Willow Creek | 4,014 | $144,350 | $48,485 |
| 28 | Southmoreland | 3,950 | $197,680 | $53,798 |
| 29 | Valentine | 1,449 | $300,000 | $44,362 |
| 30 | Roanoke | 400 | $600,000 | $85,000 |
| 31 | Birdlespur | 1,364 | $168,650 | $89,478 |
| 32 | Stayton Meadows | 2,325 | $119,400 | $64,711 |
| 33 | Lea Manor | 1,900 | $200,000 | $85,491 |
| 34 | Kirkside | 1,255 | $100,000 | $41,678 |
| 35 | Blue Hills Estates | 1,520 | $224,800 | $53,319 |
| 36 | Saint Catherine’s Gardens | 2,573 | $119,000 | $62,102 |
| 37 | Union Hill | 505 | $248,100 | $70,612 |
| 38 | Martin City | 825 | $256,800 | $65,500 |
| 39 | Hanover Place | 2,668 | $221,800 | $43,479 |
| 40 | Highview Estates | 2,096 | $246,833 | $76,796 |
| 41 | South Hyde Park | 1,949 | $193,600 | $56,936 |
| 42 | North Hyde Park | 1,875 | $245,150 | $26,801 |
| 43 | Little Blue Valley | 3,670 | $195,320 | $81,899 |
| 44 | Western Hills | 1,935 | $147,600 | $65,350 |
| 45 | Bonne Hills | 1,787 | $151,933 | $59,294 |
| 46 | Santa Fe Hills | 2,029 | $153,067 | $58,618 |
| 47 | Linden Hills And Indian Heights | 2,401 | $151,250 | $59,897 |
| 48 | Eastern 49-63 | 3,305 | $123,833 | $42,741 |
| 49 | South India Mound | 5,458 | $66,050 | $44,198 |
| 50 | North India Mound | 5,296 | $75,800 | $36,925 |
| 51 | Bannister Ares | 1,518 | $121,350 | $50,536 |
| 52 | Sarritt Point | 4,325 | $72,520 | $35,911 |
| 53 | Pendleton Heights | 3,798 | $164,225 | $33,780 |
| 54 | Holmes Park | 932 | $183,600 | $49,125 |
| 55 | Eastwood Hill East | 3,615 | $87,900 | $51,980 |
| 56 | Park Farms | 3,340 | $103,850 | $44,742 |
| 57 | Oldham Farms | 953 | $81,300 | $52,880 |
| 58 | Sterling Acres | 766 | $97,500 | $49,100 |
| 59 | Richards Gebaur | 1,125 | $202,350 | $37,652 |
| 60 | Citadel | 1,889 | $165,700 | $38,155 |
| 61 | Fairlane | 5,035 | $95,675 | $48,856 |
| 62 | Oakwood | 1,007 | $127,350 | $45,714 |
| 63 | Westside North | 2,059 | $182,233 | $54,386 |
| 64 | Fairwood And Robandee | 3,165 | $103,825 | $40,445 |
| 65 | Robandee South | 1,511 | $77,000 | $60,170 |
| 66 | Vineyard | 2,555 | $49,600 | $41,246 |
| 67 | Palestine West And Oak Park Northeast | 1,209 | $64,500 | $40,926 |
| 68 | Hillcrest | 452 | $127,800 | $40,368 |
| 69 | Loma Vista | 2,463 | $139,250 | $33,200 |
| 70 | Oak Park Southwest | 2,474 | $37,200 | $68,433 |
| 71 | Hickman Mills South | 1,301 | $70,350 | $53,599 |
| 72 | Bleheim Square-Research Hospital | 1,652 | $66,000 | $23,264 |
| 73 | Manheim Park | 1,523 | $172,600 | $32,012 |
| 74 | Swope Park Campus | 1,042 | $101,833 | $36,687 |
| 75 | Wendell Phillips | 1,761 | $158,800 | $38,080 |
| 76 | Oak Park Southeast | 1,268 | $41,100 | $37,805 |
| 77 | Ivanhoe Northeast | 866 | $44,900 | $38,728 |
| 78 | Country Valley-Hawthorn Square | 340 | $158,500 | $45,549 |
| 79 | Brown Estates | 907 | $115,100 | $52,884 |
| 80 | East Community Team South | 3,804 | $29,800 | $41,411 |
| 81 | Vineyard Northwest | 1,054 | $40,800 | $41,277 |
| 82 | Ruskin Hills | 3,088 | $88,300 | $50,824 |
| 83 | Self Help Neighborhood Council | 2,054 | $67,250 | $35,040 |
| 84 | West Blue Township | 915 | $54,200 | $32,400 |
| 85 | East Meyer | 4,625 | $76,560 | $35,925 |
| 86 | North Town Fork Creek | 2,979 | $124,514 | $35,811 |
| 87 | Riss Lake | 2,564 | $112,200 | $36,372 |
| 88 | Santa Fe | 2,103 | $56,775 | $29,174 |
| 89 | Stanford Estates | 1,771 | $80,300 | $54,219 |
| 90 | Ruskin Heights | 4,791 | $70,825 | $37,661 |
| 91 | Westside South | 1,545 | $142,600 | $42,276 |
| 92 | Blue Hills | 4,600 | $52,914 | $40,152 |
| 93 | Oak Park Northwest | 2,576 | $47,600 | $23,026 |
| 94 | East Sqope Highlands | 927 | $104,300 | $33,356 |
| 95 | Beacon Hills | 1,198 | $158,800 | $40,562 |
| 96 | Key Coalition | 1,846 | $45,500 | $26,845 |
| 97 | Ivanhoe Southeast | 1,613 | $33,200 | $38,880 |
| 98 | Ashland Ridge | 1,525 | $74,700 | $19,189 |
| 99 | Norble And Gregory Ridge | 1,842 | $66,367 | $36,942 |
| 100 | East Community Team North | 3,155 | $74,000 | $33,534 |
| 101 | Washington Weatley | 1,876 | $51,900 | $35,113 |
| 102 | Marlborough Heights-Marlborough Pride | 2,591 | $33,080 | $26,330 |
| 103 | Lewis Heights | 362 | $103,400 | $27,024 |
| 104 | Linwood Homeowner-Ivanhoe | 1,346 | $56,500 | $21,750 |
| 105 | Indipendence Plaza | 2,338 | $68,020 | $24,060 |
| 106 | Swope Parkway-Elmwood | 2,541 | $67,933 | $31,053 |
| 107 | West Blue Valley | 1,865 | $39,200 | $18,654 |
| 108 | South Town Fork Creek | 1,067 | $52,900 | $31,216 |
| 109 | Hickman Mills | 3,183 | $111,540 | $35,914 |
| 110 | Lykins | 4,392 | $56,100 | $23,420 |
| 111 | Ingleside | 1,110 | $50,750 | $33,365 |
| 112 | Northest Industrial District | 145 | $58,350 | $31,608 |
| 113 | Knoches Park | 1,930 | $41,200 | $25,932 |
| 114 | Legacy East | 1,312 | $68,600 | $18,207 |
| 115 | North Blue Ridge | 876 | $44,800 | $30,060 |
| 116 | Hidden Valley | 1,558 | $50,300 | $23,533 |
| 117 | East Blue Valley | 1,999 | $43,550 | $30,520 |
| 118 | Central Blue Valley-Park Tower Grade | 1,419 | $51,750 | $14,866 |
| 119 | Marlborough East | 1,117 | $78,333 | $29,086 |
| 120 | Sheffield | 2,555 | $45,167 | $32,100 |
| 121 | Blue Valley Industrial | 1,129 | $47,300 | $33,803 |
| 122 | Eastwood Hills West | 1,462 | $29,200 | $40,532 |
| 123 | South Blue Valley | 1,403 | $46,200 | $25,971 |