Auburn, CA
Demographics And Statistics
Living In Auburn, California Summary
Life in Auburn research summary. HomeSnacks has been using Saturday Night Science to research the quality of life in Auburn over the past nine years using Census, FBI, Zillow, and other primary data sources. Based on the most recently available data, we found the following about life in Auburn:
The population in Auburn is 13,773.
The median home value in Auburn is $604,011.
The median income in Auburn is $73,074.
The cost of living in Auburn is 128 which is 1.3x higher than the national average.
The median rent in Auburn is $1,364.
The unemployment rate in Auburn is 2.9%.
The poverty rate in Auburn is 14.5%.
The average high in Auburn is 68.3° and the average low is 43.5°.
Auburn SnackAbility
Overall SnackAbility
Auburn, CA Crime Report
Crime in Auburn summary. We use data from the FBI to determine the crime rates in Auburn. Key points include:
There were 272 total crimes in Auburn in the last reporting year.
The overall crime rate per 100,000 people in Auburn is 1,952.2 / 100k people.
The violent crime rate per 100,000 people in Auburn is 416.3 / 100k people.
The property crime rate per 100,000 people in Auburn is 1,535.9 / 100k people.
Overall, crime in Auburn is -16.01% below the national average.
Total Crimes
Below National Average
Crime In Auburn Comparison Table
| Statistic | Count Raw |
Auburn / 100k People |
California / 100k People |
National / 100k People |
|---|---|---|---|---|
| Total Crimes Per 100K | 272 | 1,952.2 | 2,581.0 | 2,324.2 |
| Violent Crime | 58 | 416.3 | 442.0 | 369.8 |
| Murder | 0 | 0.0 | 5.6 | 6.3 |
| Robbery | 4 | 28.7 | 113.6 | 66.1 |
| Aggravated Assault | 40 | 287.1 | 288.7 | 268.2 |
| Property Crime | 214 | 1,535.9 | 2,138.9 | 1,954.4 |
| Burglary | 34 | 244.0 | 369.7 | 269.8 |
| Larceny | 162 | 1,162.7 | 1,341.7 | 1,401.9 |
| Car Theft | 18 | 129.2 | 427.6 | 282.7 |
Auburn, CA Cost Of Living
Cost of living in Auburn summary. We use data on the cost of living to determine how expensive it is to live in Auburn. Real estate prices drive most of the variance in cost of living around California. Key points include:
The cost of living in Auburn is 128 with 100 being average.
The cost of living in Auburn is 1.3x higher than the national average.
The median home value in Auburn is $604,011.
The median income in Auburn is $73,074.
Auburn's Overall Cost Of Living
Higher Than The National Average
Cost Of Living In Auburn Comparison Table
| Living Expense | Auburn | California | National Average | |
|---|---|---|---|---|
| Overall | 128 | 139 | 100 | |
| Services | 107 | 110 | 100 | |
| Groceries | 107 | 112 | 100 | |
| Health | 114 | 109 | 100 | |
| Housing | 174 | 204 | 100 | |
| Transportation | 123 | 126 | 100 | |
| Utilities | 107 | 124 | 100 | |
Auburn, CA Weather
The average high in Auburn is 68.3° and the average low is 43.5°.
There are 50.9 days of precipitation each year.
Expect an average of 36.4 inches of precipitation each year with 54.3 inches of snow.
| Stat | Auburn |
|---|---|
| Average Annual High | 68.3 |
| Average Annual Low | 43.5 |
| Annual Precipitation Days | 50.9 |
| Average Annual Precipitation | 36.4 |
| Average Annual Snowfall | 54.3 |
Average High
Days of Rain
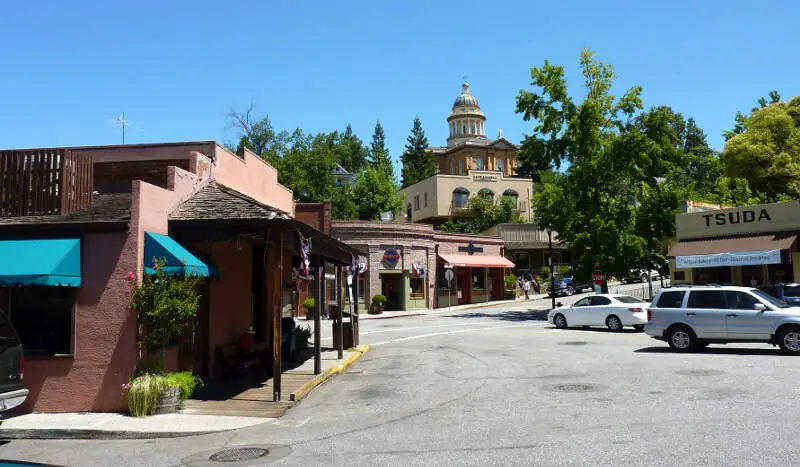
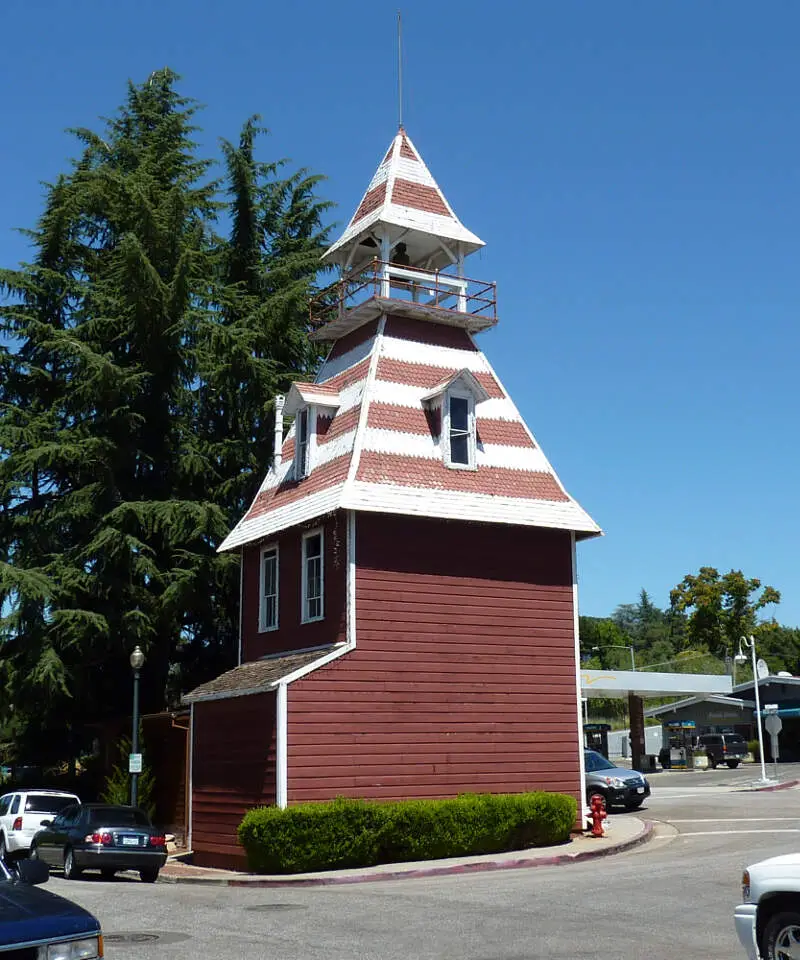
Auburn, CA Photos


Rankings for Auburn in California


Locations Around Auburn
Map Of Auburn, CA
Best Places Around Auburn
Folsom, CA
Population 81,077
Rocklin, CA
Population 71,676
Orangevale, CA
Population 35,852
Granite Bay, CA
Population 22,180
El Dorado Hills, CA
Population 49,082
Fair Oaks, CA
Population 32,754
Antelope, CA
Population 47,629
Citrus Heights, CA
Population 87,127
Loomis, CA
Population 6,831
Diamond Springs, CA
Population 12,197
Auburn Demographics And Statistics
Population over time in Auburn
The current population in Auburn is 13,773. The population has increased 2.4% from 2010.
| Year | Population | % Change |
|---|---|---|
| 2022 | 13,773 | -1.2% |
| 2021 | 13,946 | 0.3% |
| 2020 | 13,911 | 0.4% |
| 2019 | 13,858 | 0.5% |
| 2018 | 13,785 | 0.7% |
| 2017 | 13,690 | 0.9% |
| 2016 | 13,573 | 0.5% |
| 2015 | 13,502 | 0.2% |
| 2014 | 13,476 | 0.2% |
| 2013 | 13,451 | - |
Race / Ethnicity in Auburn
Auburn is:
75.8% White with 10,437 White residents.
0.6% African American with 79 African American residents.
0.2% American Indian with 27 American Indian residents.
1.4% Asian with 198 Asian residents.
0.7% Hawaiian with 95 Hawaiian residents.
0.6% Other with 80 Other residents.
6.0% Two Or More with 827 Two Or More residents.
14.7% Hispanic with 2,030 Hispanic residents.
| Race | Auburn | CA | USA |
|---|---|---|---|
| White | 75.8% | 35.2% | 58.9% |
| African American | 0.6% | 5.3% | 12.1% |
| American Indian | 0.2% | 0.3% | 0.6% |
| Asian | 1.4% | 14.9% | 5.7% |
| Hawaiian | 0.7% | 0.3% | 0.2% |
| Other | 0.6% | 0.4% | 0.4% |
| Two Or More | 6.0% | 3.8% | 3.5% |
| Hispanic | 14.7% | 39.7% | 18.7% |
Gender in Auburn
Auburn is 53.7% female with 7,400 female residents.
Auburn is 46.3% male with 6,373 male residents.
| Gender | Auburn | CA | USA |
|---|---|---|---|
| Female | 53.7% | 49.9% | 50.4% |
| Male | 46.3% | 50.1% | 49.6% |
Highest level of educational attainment in Auburn for adults over 25
3.0% of adults in Auburn completed < 9th grade.
5.0% of adults in Auburn completed 9-12th grade.
17.0% of adults in Auburn completed high school / ged.
23.0% of adults in Auburn completed some college.
14.0% of adults in Auburn completed associate's degree.
23.0% of adults in Auburn completed bachelor's degree.
10.0% of adults in Auburn completed master's degree.
4.0% of adults in Auburn completed professional degree.
1.0% of adults in Auburn completed doctorate degree.
| Education | Auburn | CA | USA |
|---|---|---|---|
| < 9th Grade | 3.0% | 9.0% | 4.0% |
| 9-12th Grade | 5.0% | 7.0% | 6.0% |
| High School / GED | 17.0% | 20.0% | 26.0% |
| Some College | 23.0% | 20.0% | 20.0% |
| Associate's Degree | 14.0% | 8.0% | 9.0% |
| Bachelor's Degree | 23.0% | 22.0% | 21.0% |
| Master's Degree | 10.0% | 9.0% | 10.0% |
| Professional Degree | 4.0% | 3.0% | 2.0% |
| Doctorate Degree | 1.0% | 2.0% | 2.0% |
Household Income For Auburn, California
4.1% of households in Auburn earn Less than $10,000.
5.9% of households in Auburn earn $10,000 to $14,999.
8.5% of households in Auburn earn $15,000 to $24,999.
9.8% of households in Auburn earn $25,000 to $34,999.
10.0% of households in Auburn earn $35,000 to $49,999.
12.5% of households in Auburn earn $50,000 to $74,999.
10.3% of households in Auburn earn $75,000 to $99,999.
17.9% of households in Auburn earn $100,000 to $149,999.
8.5% of households in Auburn earn $150,000 to $199,999.
12.7% of households in Auburn earn $200,000 or more.
| Income | Auburn | CA | USA |
|---|---|---|---|
| Less than $10,000 | 4.1% | 4.4% | 4.9% |
| $10,000 to $14,999 | 5.9% | 3.2% | 3.8% |
| $15,000 to $24,999 | 8.5% | 5.6% | 7.0% |
| $25,000 to $34,999 | 9.8% | 6.0% | 7.4% |
| $35,000 to $49,999 | 10.0% | 8.7% | 10.7% |
| $50,000 to $74,999 | 12.5% | 13.7% | 16.1% |
| $75,000 to $99,999 | 10.3% | 12.0% | 12.8% |
| $100,000 to $149,999 | 17.9% | 17.8% | 17.1% |
| $150,000 to $199,999 | 8.5% | 10.7% | 8.8% |
| $200,000 or more | 12.7% | 17.9% | 11.4% |


