Carson, CA
Demographics And Statistics
Living In Carson, California Summary
Life in Carson research summary. HomeSnacks has been using Saturday Night Science to research the quality of life in Carson over the past nine years using Census, FBI, Zillow, and other primary data sources. Based on the most recently available data, we found the following about life in Carson:
The population in Carson is 94,475.
The median home value in Carson is $750,385.
The median income in Carson is $103,045.
The cost of living in Carson is 138 which is 1.4x higher than the national average.
The median rent in Carson is $1,815.
The unemployment rate in Carson is 6.9%.
The poverty rate in Carson is 9.2%.
The average high in Carson is 75.3° and the average low is 54.1°.
Carson SnackAbility
Overall SnackAbility
Carson, CA Crime Report
Crime in Carson summary. We use data from the FBI to determine the crime rates in Carson. Key points include:
There were 2,961 total crimes in Carson in the last reporting year.
The overall crime rate per 100,000 people in Carson is 3,217.7 / 100k people.
The violent crime rate per 100,000 people in Carson is 473.8 / 100k people.
The property crime rate per 100,000 people in Carson is 2,743.9 / 100k people.
Overall, crime in Carson is 38.45% above the national average.
Total Crimes
Above National Average
Crime In Carson Comparison Table
| Statistic | Count Raw |
Carson / 100k People |
California / 100k People |
National / 100k People |
|---|---|---|---|---|
| Total Crimes Per 100K | 2,961 | 3,217.7 | 2,581.0 | 2,324.2 |
| Violent Crime | 436 | 473.8 | 442.0 | 369.8 |
| Murder | 7 | 7.6 | 5.6 | 6.3 |
| Robbery | 122 | 132.6 | 113.6 | 66.1 |
| Aggravated Assault | 292 | 317.3 | 288.7 | 268.2 |
| Property Crime | 2,525 | 2,743.9 | 2,138.9 | 1,954.4 |
| Burglary | 372 | 404.3 | 369.7 | 269.8 |
| Larceny | 1,311 | 1,424.7 | 1,341.7 | 1,401.9 |
| Car Theft | 842 | 915.0 | 427.6 | 282.7 |
Carson, CA Cost Of Living
Cost of living in Carson summary. We use data on the cost of living to determine how expensive it is to live in Carson. Real estate prices drive most of the variance in cost of living around California. Key points include:
The cost of living in Carson is 138 with 100 being average.
The cost of living in Carson is 1.4x higher than the national average.
The median home value in Carson is $750,385.
The median income in Carson is $103,045.
Carson's Overall Cost Of Living
Higher Than The National Average
Cost Of Living In Carson Comparison Table
| Living Expense | Carson | California | National Average | |
|---|---|---|---|---|
| Overall | 138 | 139 | 100 | |
| Services | 118 | 110 | 100 | |
| Groceries | 112 | 112 | 100 | |
| Health | 113 | 109 | 100 | |
| Housing | 185 | 204 | 100 | |
| Transportation | 127 | 126 | 100 | |
| Utilities | 112 | 124 | 100 | |
Carson, CA Weather
The average high in Carson is 75.3° and the average low is 54.1°.
There are 22.7 days of precipitation each year.
Expect an average of 16.2 inches of precipitation each year with 0.2 inches of snow.
| Stat | Carson |
|---|---|
| Average Annual High | 75.3 |
| Average Annual Low | 54.1 |
| Annual Precipitation Days | 22.7 |
| Average Annual Precipitation | 16.2 |
| Average Annual Snowfall | 0.2 |
Average High
Days of Rain
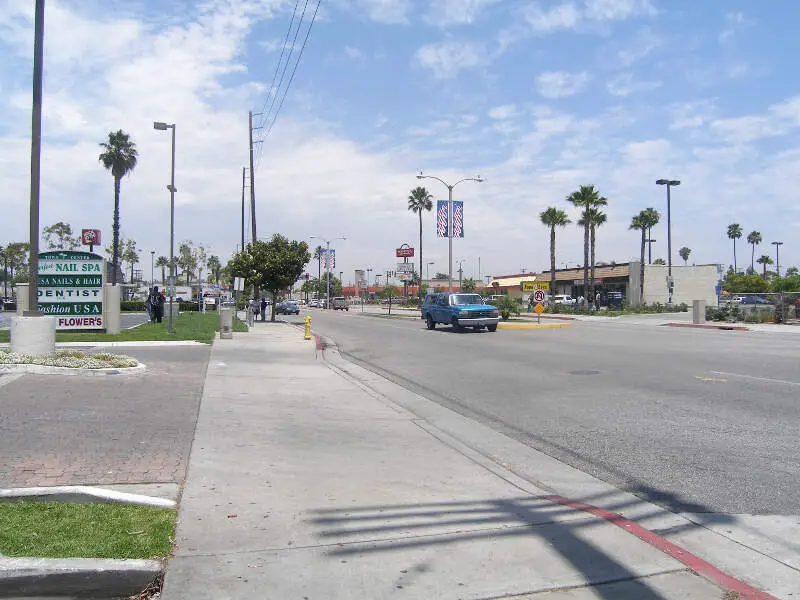
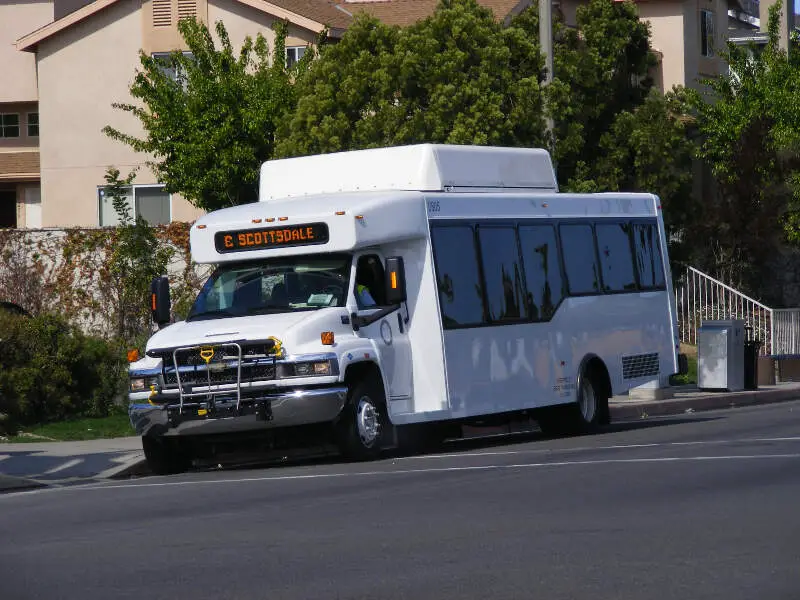
Carson, CA Photos
1 Reviews & Comments About Carson
/5

HomeSnacks User - 2018-07-15 20:41:17.504512
There are too many people here which makes traffic terrible. The area isn't generally safe, as there are gang members in many neighborhoods. I find that there is a lot of noise at any given point throughout the day, such as fireworks on a Tuesday night. It's really disturbing for those who want peace and quiet, if I have work the next morning.
What I like is the variety of different spanish and filipino foods and restaurants out here.
Rankings for Carson in California


Locations Around Carson
Map Of Carson, CA
Best Places Around Carson
Del Aire, CA
Population 10,756
La Mirada, CA
Population 47,644
Lakewood, CA
Population 81,499
Cypress, CA
Population 49,955
Rossmoor, CA
Population 11,742
La Palma, CA
Population 15,522
Artesia, CA
Population 16,237
Fountain Valley, CA
Population 56,754
Avocado Heights, CA
Population 13,470
Cerritos, CA
Population 49,016
Carson Demographics And Statistics
Population over time in Carson
The current population in Carson is 94,475. The population has increased 3.5% from 2010.
| Year | Population | % Change |
|---|---|---|
| 2022 | 94,475 | 2.1% |
| 2021 | 92,517 | -0.4% |
| 2020 | 92,927 | 0.2% |
| 2019 | 92,780 | 0.1% |
| 2018 | 92,691 | 0.2% |
| 2017 | 92,475 | 0.5% |
| 2016 | 91,994 | 0.1% |
| 2015 | 91,937 | 0.5% |
| 2014 | 91,508 | 0.2% |
| 2013 | 91,299 | - |
Race / Ethnicity in Carson
Carson is:
6.3% White with 5,992 White residents.
22.3% African American with 21,049 African American residents.
0.1% American Indian with 95 American Indian residents.
25.0% Asian with 23,659 Asian residents.
1.8% Hawaiian with 1,738 Hawaiian residents.
0.3% Other with 315 Other residents.
3.8% Two Or More with 3,585 Two Or More residents.
40.3% Hispanic with 38,042 Hispanic residents.
| Race | Carson | CA | USA |
|---|---|---|---|
| White | 6.3% | 35.2% | 58.9% |
| African American | 22.3% | 5.3% | 12.1% |
| American Indian | 0.1% | 0.3% | 0.6% |
| Asian | 25.0% | 14.9% | 5.7% |
| Hawaiian | 1.8% | 0.3% | 0.2% |
| Other | 0.3% | 0.4% | 0.4% |
| Two Or More | 3.8% | 3.8% | 3.5% |
| Hispanic | 40.3% | 39.7% | 18.7% |
Gender in Carson
Carson is 50.3% female with 47,533 female residents.
Carson is 49.7% male with 46,942 male residents.
| Gender | Carson | CA | USA |
|---|---|---|---|
| Female | 50.3% | 49.9% | 50.4% |
| Male | 49.7% | 50.1% | 49.6% |
Highest level of educational attainment in Carson for adults over 25
8.0% of adults in Carson completed < 9th grade.
9.0% of adults in Carson completed 9-12th grade.
22.0% of adults in Carson completed high school / ged.
23.0% of adults in Carson completed some college.
8.0% of adults in Carson completed associate's degree.
22.0% of adults in Carson completed bachelor's degree.
7.0% of adults in Carson completed master's degree.
1.0% of adults in Carson completed professional degree.
0.0% of adults in Carson completed doctorate degree.
| Education | Carson | CA | USA |
|---|---|---|---|
| < 9th Grade | 8.0% | 9.0% | 4.0% |
| 9-12th Grade | 9.0% | 7.0% | 6.0% |
| High School / GED | 22.0% | 20.0% | 26.0% |
| Some College | 23.0% | 20.0% | 20.0% |
| Associate's Degree | 8.0% | 8.0% | 9.0% |
| Bachelor's Degree | 22.0% | 22.0% | 21.0% |
| Master's Degree | 7.0% | 9.0% | 10.0% |
| Professional Degree | 1.0% | 3.0% | 2.0% |
| Doctorate Degree | 0.0% | 2.0% | 2.0% |
Household Income For Carson, California
3.4% of households in Carson earn Less than $10,000.
2.8% of households in Carson earn $10,000 to $14,999.
4.4% of households in Carson earn $15,000 to $24,999.
5.3% of households in Carson earn $25,000 to $34,999.
6.3% of households in Carson earn $35,000 to $49,999.
13.3% of households in Carson earn $50,000 to $74,999.
12.7% of households in Carson earn $75,000 to $99,999.
23.1% of households in Carson earn $100,000 to $149,999.
12.6% of households in Carson earn $150,000 to $199,999.
16.0% of households in Carson earn $200,000 or more.
| Income | Carson | CA | USA |
|---|---|---|---|
| Less than $10,000 | 3.4% | 4.4% | 4.9% |
| $10,000 to $14,999 | 2.8% | 3.2% | 3.8% |
| $15,000 to $24,999 | 4.4% | 5.6% | 7.0% |
| $25,000 to $34,999 | 5.3% | 6.0% | 7.4% |
| $35,000 to $49,999 | 6.3% | 8.7% | 10.7% |
| $50,000 to $74,999 | 13.3% | 13.7% | 16.1% |
| $75,000 to $99,999 | 12.7% | 12.0% | 12.8% |
| $100,000 to $149,999 | 23.1% | 17.8% | 17.1% |
| $150,000 to $199,999 | 12.6% | 10.7% | 8.8% |
| $200,000 or more | 16.0% | 17.9% | 11.4% |


