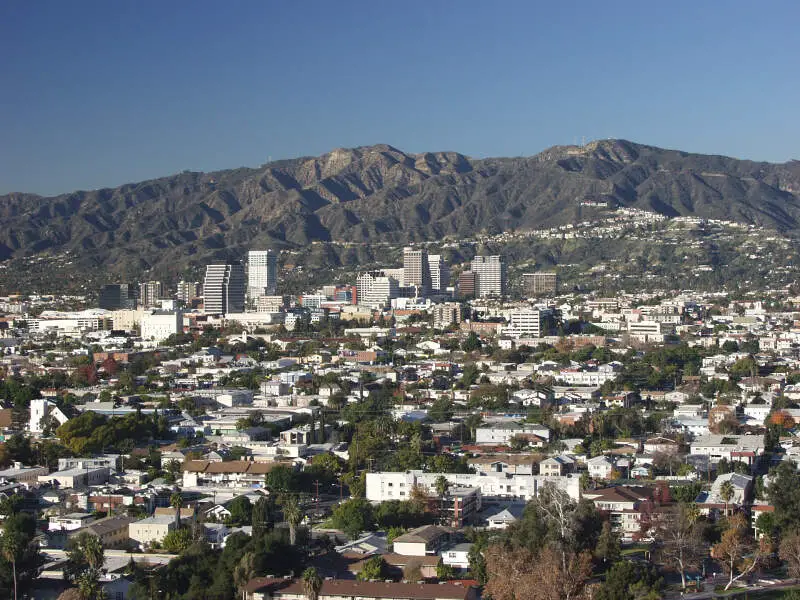
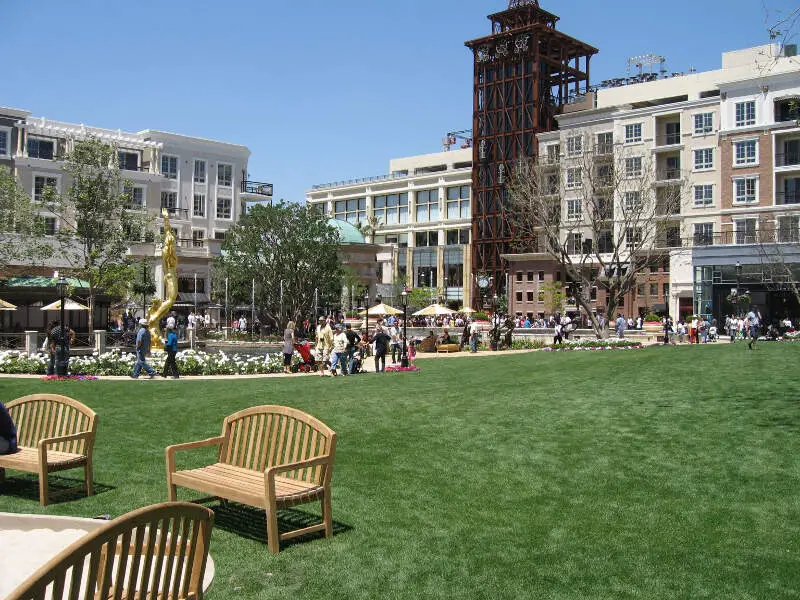
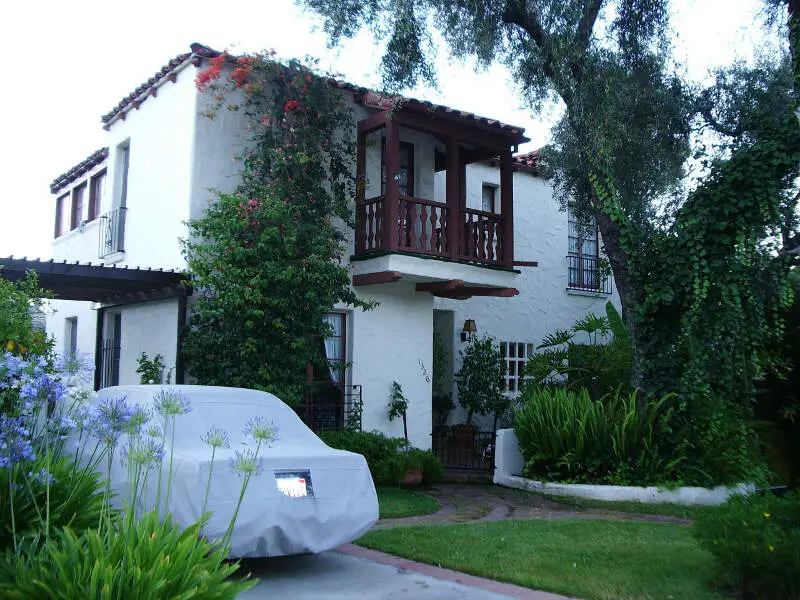
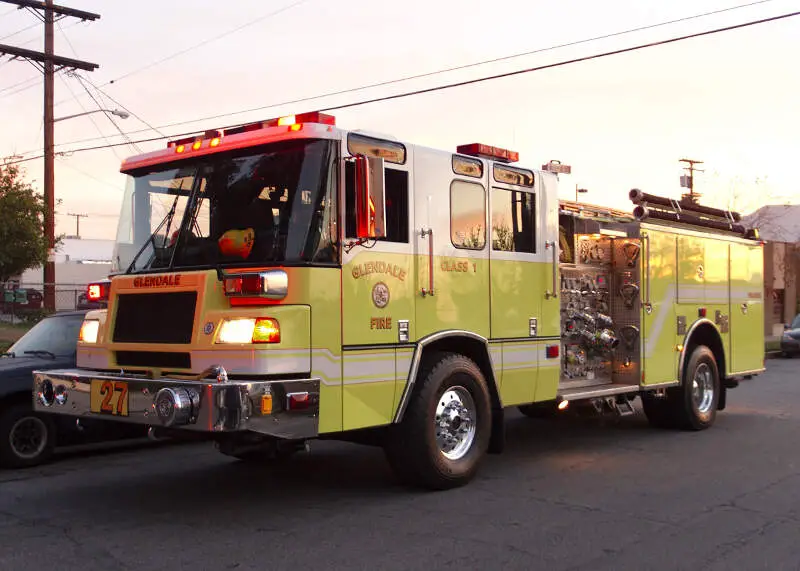
Glendale, CA
Demographics And Statistics
Living In Glendale, California Summary
Life in Glendale research summary. HomeSnacks has been using Saturday Night Science to research the quality of life in Glendale over the past nine years using Census, FBI, Zillow, and other primary data sources. Based on the most recently available data, we found the following about life in Glendale:
The population in Glendale is 194,512.
The median home value in Glendale is $1,134,103.
The median income in Glendale is $81,219.
The cost of living in Glendale is 167 which is 1.7x higher than the national average.
The median rent in Glendale is $2,002.
The unemployment rate in Glendale is 8.1%.
The poverty rate in Glendale is 13.4%.
The average high in Glendale is 75.3° and the average low is 54.1°.
Glendale SnackAbility
Overall SnackAbility
Glendale, CA Crime Report
Crime in Glendale summary. We use data from the FBI to determine the crime rates in Glendale. Key points include:
There were 3,727 total crimes in Glendale in the last reporting year.
The overall crime rate per 100,000 people in Glendale is 1,976.2 / 100k people.
The violent crime rate per 100,000 people in Glendale is 150.1 / 100k people.
The property crime rate per 100,000 people in Glendale is 1,826.1 / 100k people.
Overall, crime in Glendale is -14.97% below the national average.
Total Crimes
Below National Average
Crime In Glendale Comparison Table
| Statistic | Count Raw |
Glendale / 100k People |
California / 100k People |
National / 100k People |
|---|---|---|---|---|
| Total Crimes Per 100K | 3,727 | 1,976.2 | 2,581.0 | 2,324.2 |
| Violent Crime | 283 | 150.1 | 442.0 | 369.8 |
| Murder | 0 | 0.0 | 5.6 | 6.3 |
| Robbery | 130 | 68.9 | 113.6 | 66.1 |
| Aggravated Assault | 135 | 71.6 | 288.7 | 268.2 |
| Property Crime | 3,444 | 1,826.1 | 2,138.9 | 1,954.4 |
| Burglary | 486 | 257.7 | 369.7 | 269.8 |
| Larceny | 2,545 | 1,349.4 | 1,341.7 | 1,401.9 |
| Car Theft | 413 | 219.0 | 427.6 | 282.7 |
Glendale, CA Cost Of Living
Cost of living in Glendale summary. We use data on the cost of living to determine how expensive it is to live in Glendale. Real estate prices drive most of the variance in cost of living around California. Key points include:
The cost of living in Glendale is 167 with 100 being average.
The cost of living in Glendale is 1.7x higher than the national average.
The median home value in Glendale is $1,134,103.
The median income in Glendale is $81,219.
Glendale's Overall Cost Of Living
Higher Than The National Average
Cost Of Living In Glendale Comparison Table
| Living Expense | Glendale | California | National Average | |
|---|---|---|---|---|
| Overall | 167 | 139 | 100 | |
| Services | 115 | 110 | 100 | |
| Groceries | 113 | 112 | 100 | |
| Health | 114 | 109 | 100 | |
| Housing | 287 | 204 | 100 | |
| Transportation | 127 | 126 | 100 | |
| Utilities | 111 | 124 | 100 | |
Glendale, CA Weather
The average high in Glendale is 75.3° and the average low is 54.1°.
There are 22.7 days of precipitation each year.
Expect an average of 16.2 inches of precipitation each year with 0.2 inches of snow.
| Stat | Glendale |
|---|---|
| Average Annual High | 75.3 |
| Average Annual Low | 54.1 |
| Annual Precipitation Days | 22.7 |
| Average Annual Precipitation | 16.2 |
| Average Annual Snowfall | 0.2 |
Average High
Days of Rain
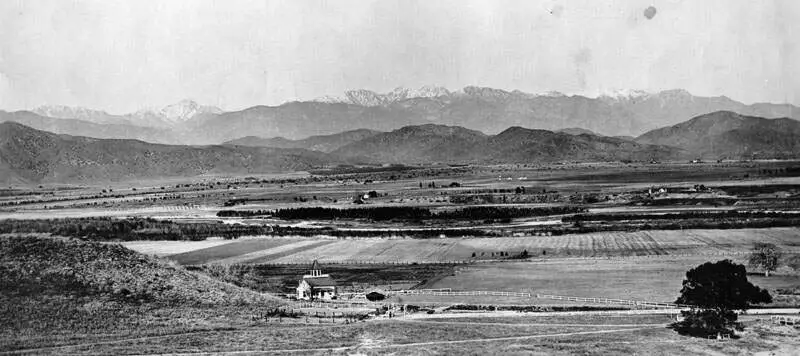
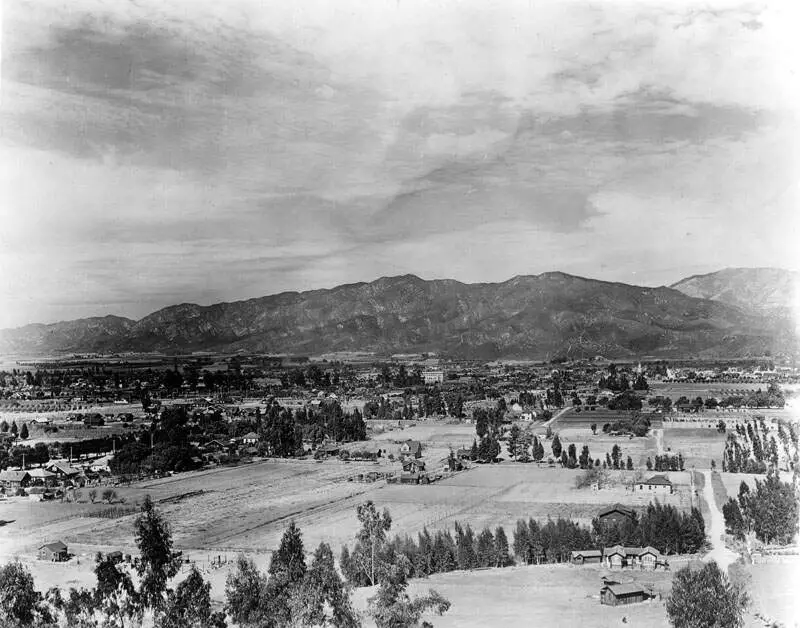
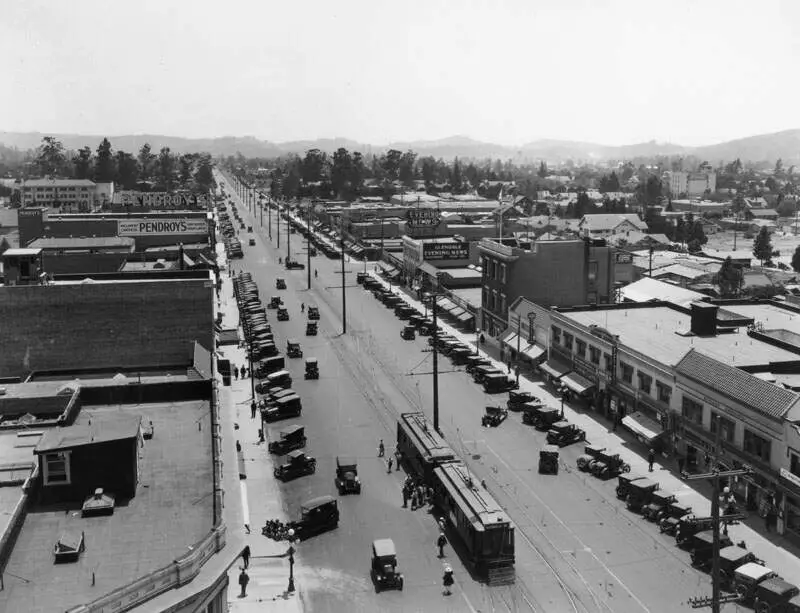
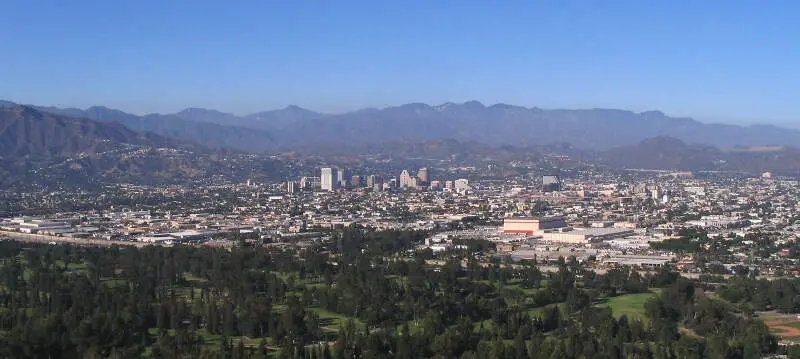
Glendale, CA Photos
Glendale Articles


Rankings for Glendale in California
Locations Around Glendale
Map Of Glendale, CA
Best Places Around Glendale
Del Aire, CA
Population 10,756
Vincent, CA
Population 15,266
West Puente Valley, CA
Population 22,074
South Monrovia Island, CA
Population 6,833
Avocado Heights, CA
Population 13,470
San Fernando, CA
Population 23,958
La Crescenta-Montrose, CA
Population 20,092
South Pasadena, CA
Population 26,583
West Whittier-Los Nietos, CA
Population 25,442
Altadena, CA
Population 42,719
Glendale Demographics And Statistics
Population over time in Glendale
The current population in Glendale is 194,512. The population has increased 1.2% from 2010.
| Year | Population | % Change |
|---|---|---|
| 2022 | 194,512 | -2.9% |
| 2021 | 200,372 | 0.3% |
| 2020 | 199,750 | 0.9% |
| 2019 | 197,895 | 0.5% |
| 2018 | 196,984 | 0.8% |
| 2017 | 195,380 | 1.0% |
| 2016 | 193,381 | 0.4% |
| 2015 | 192,537 | 0.2% |
| 2014 | 192,069 | -0.1% |
| 2013 | 192,190 | - |
Race / Ethnicity in Glendale
Glendale is:
61.5% White with 119,589 White residents.
1.7% African American with 3,287 African American residents.
0.1% American Indian with 168 American Indian residents.
13.6% Asian with 26,537 Asian residents.
0.2% Hawaiian with 321 Hawaiian residents.
0.3% Other with 665 Other residents.
3.7% Two Or More with 7,244 Two Or More residents.
18.9% Hispanic with 36,701 Hispanic residents.
| Race | Glendale | CA | USA |
|---|---|---|---|
| White | 61.5% | 35.2% | 58.9% |
| African American | 1.7% | 5.3% | 12.1% |
| American Indian | 0.1% | 0.3% | 0.6% |
| Asian | 13.6% | 14.9% | 5.7% |
| Hawaiian | 0.2% | 0.3% | 0.2% |
| Other | 0.3% | 0.4% | 0.4% |
| Two Or More | 3.7% | 3.8% | 3.5% |
| Hispanic | 18.9% | 39.7% | 18.7% |
Gender in Glendale
Glendale is 52.5% female with 102,113 female residents.
Glendale is 47.5% male with 92,399 male residents.
| Gender | Glendale | CA | USA |
|---|---|---|---|
| Female | 52.5% | 49.9% | 50.4% |
| Male | 47.5% | 50.1% | 49.6% |
Highest level of educational attainment in Glendale for adults over 25
8.0% of adults in Glendale completed < 9th grade.
4.0% of adults in Glendale completed 9-12th grade.
21.0% of adults in Glendale completed high school / ged.
14.0% of adults in Glendale completed some college.
9.0% of adults in Glendale completed associate's degree.
28.0% of adults in Glendale completed bachelor's degree.
11.0% of adults in Glendale completed master's degree.
3.0% of adults in Glendale completed professional degree.
2.0% of adults in Glendale completed doctorate degree.
| Education | Glendale | CA | USA |
|---|---|---|---|
| < 9th Grade | 8.0% | 9.0% | 4.0% |
| 9-12th Grade | 4.0% | 7.0% | 6.0% |
| High School / GED | 21.0% | 20.0% | 26.0% |
| Some College | 14.0% | 20.0% | 20.0% |
| Associate's Degree | 9.0% | 8.0% | 9.0% |
| Bachelor's Degree | 28.0% | 22.0% | 21.0% |
| Master's Degree | 11.0% | 9.0% | 10.0% |
| Professional Degree | 3.0% | 3.0% | 2.0% |
| Doctorate Degree | 2.0% | 2.0% | 2.0% |
Household Income For Glendale, California
5.3% of households in Glendale earn Less than $10,000.
6.5% of households in Glendale earn $10,000 to $14,999.
6.7% of households in Glendale earn $15,000 to $24,999.
6.7% of households in Glendale earn $25,000 to $34,999.
8.3% of households in Glendale earn $35,000 to $49,999.
13.1% of households in Glendale earn $50,000 to $74,999.
12.6% of households in Glendale earn $75,000 to $99,999.
15.7% of households in Glendale earn $100,000 to $149,999.
9.8% of households in Glendale earn $150,000 to $199,999.
15.2% of households in Glendale earn $200,000 or more.
| Income | Glendale | CA | USA |
|---|---|---|---|
| Less than $10,000 | 5.3% | 4.4% | 4.9% |
| $10,000 to $14,999 | 6.5% | 3.2% | 3.8% |
| $15,000 to $24,999 | 6.7% | 5.6% | 7.0% |
| $25,000 to $34,999 | 6.7% | 6.0% | 7.4% |
| $35,000 to $49,999 | 8.3% | 8.7% | 10.7% |
| $50,000 to $74,999 | 13.1% | 13.7% | 16.1% |
| $75,000 to $99,999 | 12.6% | 12.0% | 12.8% |
| $100,000 to $149,999 | 15.7% | 17.8% | 17.1% |
| $150,000 to $199,999 | 9.8% | 10.7% | 8.8% |
| $200,000 or more | 15.2% | 17.9% | 11.4% |


