Goleta, CA
Demographics And Statistics
Living In Goleta, California Summary
Life in Goleta research summary. HomeSnacks has been using Saturday Night Science to research the quality of life in Goleta over the past nine years using Census, FBI, Zillow, and other primary data sources. Based on the most recently available data, we found the following about life in Goleta:
The population in Goleta is 32,640.
The median home value in Goleta is $1,308,615.
The median income in Goleta is $113,889.
The cost of living in Goleta is 171 which is 1.7x higher than the national average.
The median rent in Goleta is $2,210.
The unemployment rate in Goleta is 4.0%.
The poverty rate in Goleta is 11.5%.
The average high in Goleta is 69.8° and the average low is 48.8°.
Goleta SnackAbility
Overall SnackAbility
Goleta, CA Crime Report
Crime in Goleta summary. We use data from the FBI to determine the crime rates in Goleta. Key points include:
There were 584 total crimes in Goleta in the last reporting year.
The overall crime rate per 100,000 people in Goleta is 1,773.5 / 100k people.
The violent crime rate per 100,000 people in Goleta is 148.8 / 100k people.
The property crime rate per 100,000 people in Goleta is 1,624.7 / 100k people.
Overall, crime in Goleta is -23.69% below the national average.
Total Crimes
Below National Average
Crime In Goleta Comparison Table
| Statistic | Count Raw |
Goleta / 100k People |
California / 100k People |
National / 100k People |
|---|---|---|---|---|
| Total Crimes Per 100K | 584 | 1,773.5 | 2,581.0 | 2,324.2 |
| Violent Crime | 49 | 148.8 | 442.0 | 369.8 |
| Murder | 1 | 3.0 | 5.6 | 6.3 |
| Robbery | 9 | 27.3 | 113.6 | 66.1 |
| Aggravated Assault | 35 | 106.3 | 288.7 | 268.2 |
| Property Crime | 535 | 1,624.7 | 2,138.9 | 1,954.4 |
| Burglary | 88 | 267.2 | 369.7 | 269.8 |
| Larceny | 415 | 1,260.3 | 1,341.7 | 1,401.9 |
| Car Theft | 32 | 97.2 | 427.6 | 282.7 |
Goleta, CA Cost Of Living
Cost of living in Goleta summary. We use data on the cost of living to determine how expensive it is to live in Goleta. Real estate prices drive most of the variance in cost of living around California. Key points include:
The cost of living in Goleta is 171 with 100 being average.
The cost of living in Goleta is 1.7x higher than the national average.
The median home value in Goleta is $1,308,615.
The median income in Goleta is $113,889.
Goleta's Overall Cost Of Living
Higher Than The National Average
Cost Of Living In Goleta Comparison Table
| Living Expense | Goleta | California | National Average | |
|---|---|---|---|---|
| Overall | 171 | 139 | 100 | |
| Services | 104 | 110 | 100 | |
| Groceries | 112 | 112 | 100 | |
| Health | 103 | 109 | 100 | |
| Housing | 300 | 204 | 100 | |
| Transportation | 114 | 126 | 100 | |
| Utilities | 158 | 124 | 100 | |
Goleta, CA Weather
The average high in Goleta is 69.8° and the average low is 48.8°.
There are 27.0 days of precipitation each year.
Expect an average of 18.1 inches of precipitation each year with 0.0 inches of snow.
| Stat | Goleta |
|---|---|
| Average Annual High | 69.8 |
| Average Annual Low | 48.8 |
| Annual Precipitation Days | 27.0 |
| Average Annual Precipitation | 18.1 |
| Average Annual Snowfall | 0.0 |
Average High
Days of Rain
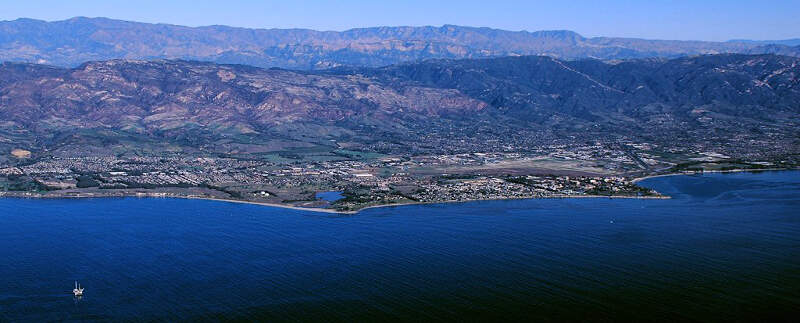
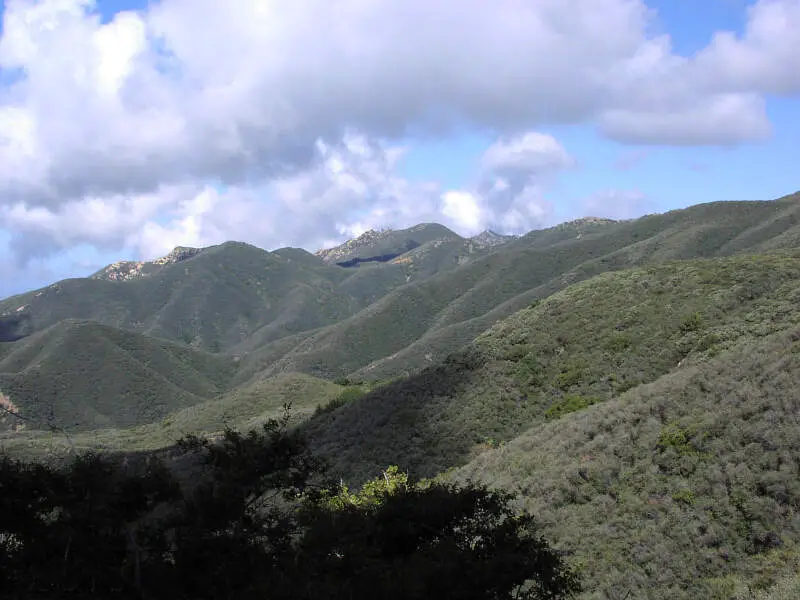
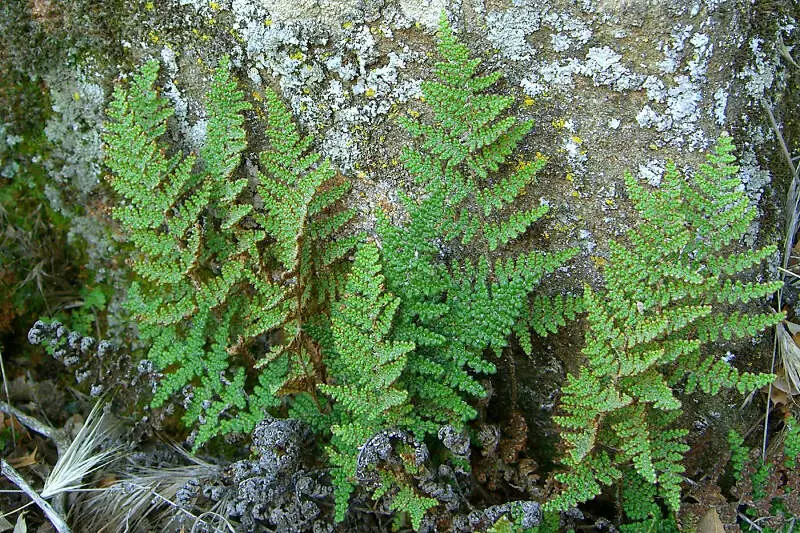
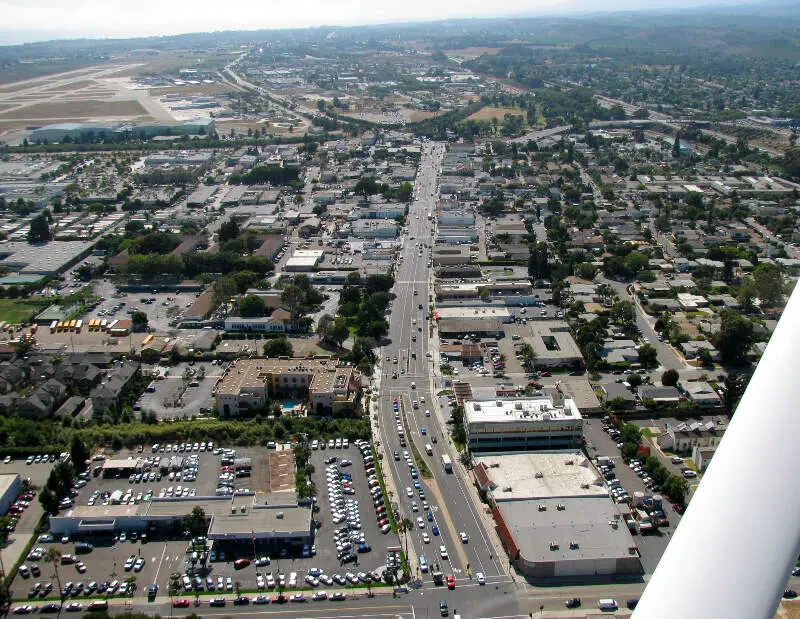
Goleta, CA Photos
Rankings for Goleta in California


Locations Around Goleta
Map Of Goleta, CA
Best Places Around Goleta
Camarillo, CA
Population 70,622
Orcutt, CA
Population 31,137
Solvang, CA
Population 6,035
Carpinteria, CA
Population 13,187
Santa Barbara, CA
Population 88,640
Isla Vista, CA
Population 14,722
Santa Maria, CA
Population 109,543
Mira Monte, CA
Population 6,837
Oxnard, CA
Population 202,279
Port Hueneme, CA
Population 21,847
Goleta Demographics And Statistics
Population over time in Goleta
The current population in Goleta is 32,640. The population has increased 11.0% from 2010.
| Year | Population | % Change |
|---|---|---|
| 2022 | 32,640 | 6.0% |
| 2021 | 30,790 | -0.2% |
| 2020 | 30,847 | 0.6% |
| 2019 | 30,671 | 0.4% |
| 2018 | 30,541 | 0.7% |
| 2017 | 30,333 | 0.9% |
| 2016 | 30,074 | 0.7% |
| 2015 | 29,862 | 0.8% |
| 2014 | 29,634 | 0.8% |
| 2013 | 29,397 | - |
Race / Ethnicity in Goleta
Goleta is:
46.3% White with 15,108 White residents.
2.3% African American with 761 African American residents.
0.0% American Indian with 0 American Indian residents.
10.5% Asian with 3,421 Asian residents.
0.0% Hawaiian with 0 Hawaiian residents.
0.2% Other with 77 Other residents.
4.3% Two Or More with 1,397 Two Or More residents.
36.4% Hispanic with 11,876 Hispanic residents.
| Race | Goleta | CA | USA |
|---|---|---|---|
| White | 46.3% | 35.2% | 58.9% |
| African American | 2.3% | 5.3% | 12.1% |
| American Indian | 0.0% | 0.3% | 0.6% |
| Asian | 10.5% | 14.9% | 5.7% |
| Hawaiian | 0.0% | 0.3% | 0.2% |
| Other | 0.2% | 0.4% | 0.4% |
| Two Or More | 4.3% | 3.8% | 3.5% |
| Hispanic | 36.4% | 39.7% | 18.7% |
Gender in Goleta
Goleta is 48.3% female with 15,761 female residents.
Goleta is 51.7% male with 16,879 male residents.
| Gender | Goleta | CA | USA |
|---|---|---|---|
| Female | 48.3% | 49.9% | 50.4% |
| Male | 51.7% | 50.1% | 49.6% |
Highest level of educational attainment in Goleta for adults over 25
8.0% of adults in Goleta completed < 9th grade.
5.0% of adults in Goleta completed 9-12th grade.
12.0% of adults in Goleta completed high school / ged.
17.0% of adults in Goleta completed some college.
9.0% of adults in Goleta completed associate's degree.
29.0% of adults in Goleta completed bachelor's degree.
11.0% of adults in Goleta completed master's degree.
2.0% of adults in Goleta completed professional degree.
7.0% of adults in Goleta completed doctorate degree.
| Education | Goleta | CA | USA |
|---|---|---|---|
| < 9th Grade | 8.0% | 9.0% | 4.0% |
| 9-12th Grade | 5.0% | 7.0% | 6.0% |
| High School / GED | 12.0% | 20.0% | 26.0% |
| Some College | 17.0% | 20.0% | 20.0% |
| Associate's Degree | 9.0% | 8.0% | 9.0% |
| Bachelor's Degree | 29.0% | 22.0% | 21.0% |
| Master's Degree | 11.0% | 9.0% | 10.0% |
| Professional Degree | 2.0% | 3.0% | 2.0% |
| Doctorate Degree | 7.0% | 2.0% | 2.0% |
Household Income For Goleta, California
4.3% of households in Goleta earn Less than $10,000.
2.7% of households in Goleta earn $10,000 to $14,999.
3.5% of households in Goleta earn $15,000 to $24,999.
2.4% of households in Goleta earn $25,000 to $34,999.
7.6% of households in Goleta earn $35,000 to $49,999.
13.4% of households in Goleta earn $50,000 to $74,999.
10.3% of households in Goleta earn $75,000 to $99,999.
21.2% of households in Goleta earn $100,000 to $149,999.
12.8% of households in Goleta earn $150,000 to $199,999.
22.0% of households in Goleta earn $200,000 or more.
| Income | Goleta | CA | USA |
|---|---|---|---|
| Less than $10,000 | 4.3% | 4.4% | 4.9% |
| $10,000 to $14,999 | 2.7% | 3.2% | 3.8% |
| $15,000 to $24,999 | 3.5% | 5.6% | 7.0% |
| $25,000 to $34,999 | 2.4% | 6.0% | 7.4% |
| $35,000 to $49,999 | 7.6% | 8.7% | 10.7% |
| $50,000 to $74,999 | 13.4% | 13.7% | 16.1% |
| $75,000 to $99,999 | 10.3% | 12.0% | 12.8% |
| $100,000 to $149,999 | 21.2% | 17.8% | 17.1% |
| $150,000 to $199,999 | 12.8% | 10.7% | 8.8% |
| $200,000 or more | 22.0% | 17.9% | 11.4% |


