Marina del Rey, CA
Demographics And Statistics
Living In Marina del Rey, California Summary
Life in Marina del Rey research summary. HomeSnacks has been using Saturday Night Science to research the quality of life in Marina del Rey over the past nine years using Census, FBI, Zillow, and other primary data sources. Based on the most recently available data, we found the following about life in Marina del Rey:
The population in Marina del Rey is 10,274.
The median home value in Marina del Rey is $1,050,002.
The median income in Marina del Rey is $135,584.
The cost of living in Marina del Rey is 161 which is 1.6x higher than the national average.
The median rent in Marina del Rey is $3,494.
The unemployment rate in Marina del Rey is 5.2%.
The poverty rate in Marina del Rey is 4.0%.
The average high in Marina del Rey is 75.3° and the average low is 54.1°.
Table Of Contents
Marina Del Rey SnackAbility
Overall SnackAbility
Marina Del Rey, CA Cost Of Living
Cost of living in Marina del Rey summary. We use data on the cost of living to determine how expensive it is to live in Marina del Rey. Real estate prices drive most of the variance in cost of living around California. Key points include:
The cost of living in Marina del Rey is 161 with 100 being average.
The cost of living in Marina del Rey is 1.6x higher than the national average.
The median home value in Marina del Rey is $1,050,002.
The median income in Marina del Rey is $135,584.
Marina Del Rey's Overall Cost Of Living
Higher Than The National Average
Cost Of Living In Marina del Rey Comparison Table
| Living Expense | Marina del Rey | California | National Average | |
|---|---|---|---|---|
| Overall | 161 | 139 | 100 | |
| Services | 117 | 110 | 100 | |
| Groceries | 110 | 112 | 100 | |
| Health | 114 | 109 | 100 | |
| Housing | 270 | 204 | 100 | |
| Transportation | 129 | 126 | 100 | |
| Utilities | 112 | 124 | 100 | |
Marina Del Rey, CA Weather
The average high in Marina del Rey is 75.3° and the average low is 54.1°.
There are 22.7 days of precipitation each year.
Expect an average of 16.2 inches of precipitation each year with 0.2 inches of snow.
| Stat | Marina del Rey |
|---|---|
| Average Annual High | 75.3 |
| Average Annual Low | 54.1 |
| Annual Precipitation Days | 22.7 |
| Average Annual Precipitation | 16.2 |
| Average Annual Snowfall | 0.2 |
Average High
Days of Rain
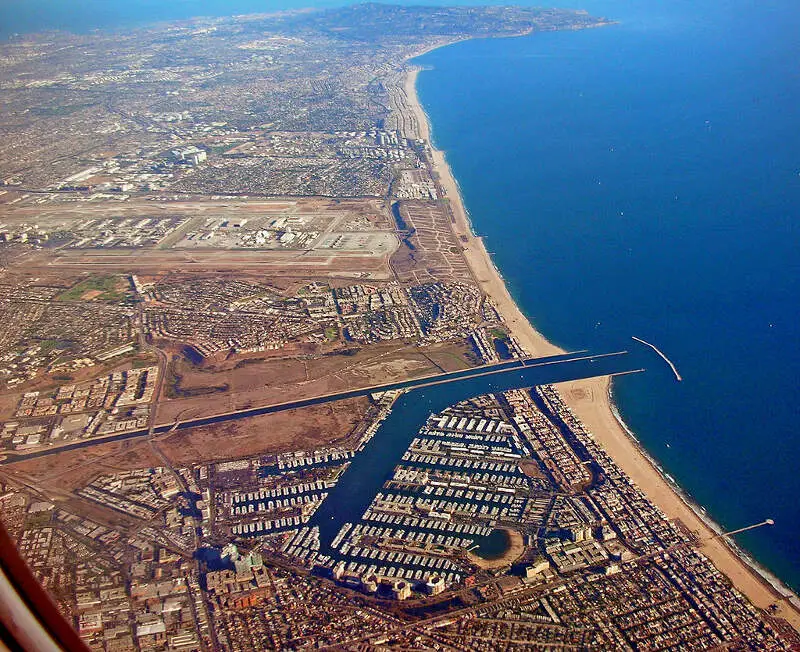
Marina Del Rey, CA Photos
Rankings for Marina del Rey in California


Locations Around Marina del Rey
Map Of Marina del Rey, CA
Best Places Around Marina del Rey
Del Aire, CA
Population 10,756
Torrance, CA
Population 145,454
South Pasadena, CA
Population 26,583
Redondo Beach, CA
Population 70,620
Rancho Palos Verdes, CA
Population 41,805
Ladera Heights, CA
Population 6,710
West Carson, CA
Population 22,240
Lomita, CA
Population 20,662
Rolling Hills Estates, CA
Population 8,214
Monterey Park, CA
Population 60,386
Marina del Rey Demographics And Statistics
Population over time in Marina del Rey
The current population in Marina del Rey is 10,274. The population has increased 11.7% from 2010.
| Year | Population | % Change |
|---|---|---|
| 2022 | 10,274 | 5.1% |
| 2021 | 9,771 | 0.8% |
| 2020 | 9,691 | -0.9% |
| 2019 | 9,782 | 5.3% |
| 2018 | 9,289 | 1.4% |
| 2017 | 9,157 | 3.3% |
| 2016 | 8,866 | -2.4% |
| 2015 | 9,087 | 2.8% |
| 2014 | 8,840 | -3.9% |
| 2013 | 9,196 | - |
Race / Ethnicity in Marina del Rey
Marina del Rey is:
68.8% White with 7,066 White residents.
6.3% African American with 645 African American residents.
0.0% American Indian with 0 American Indian residents.
10.2% Asian with 1,044 Asian residents.
0.3% Hawaiian with 32 Hawaiian residents.
0.4% Other with 44 Other residents.
6.1% Two Or More with 622 Two Or More residents.
8.0% Hispanic with 821 Hispanic residents.
| Race | Marina del Rey | CA | USA |
|---|---|---|---|
| White | 68.8% | 35.2% | 58.9% |
| African American | 6.3% | 5.3% | 12.1% |
| American Indian | 0.0% | 0.3% | 0.6% |
| Asian | 10.2% | 14.9% | 5.7% |
| Hawaiian | 0.3% | 0.3% | 0.2% |
| Other | 0.4% | 0.4% | 0.4% |
| Two Or More | 6.1% | 3.8% | 3.5% |
| Hispanic | 8.0% | 39.7% | 18.7% |
Gender in Marina del Rey
Marina del Rey is 53.7% female with 5,516 female residents.
Marina del Rey is 46.3% male with 4,758 male residents.
| Gender | Marina del Rey | CA | USA |
|---|---|---|---|
| Female | 53.7% | 49.9% | 50.4% |
| Male | 46.3% | 50.1% | 49.6% |
Highest level of educational attainment in Marina del Rey for adults over 25
0.0% of adults in Marina del Rey completed < 9th grade.
0.0% of adults in Marina del Rey completed 9-12th grade.
6.0% of adults in Marina del Rey completed high school / ged.
13.0% of adults in Marina del Rey completed some college.
8.0% of adults in Marina del Rey completed associate's degree.
45.0% of adults in Marina del Rey completed bachelor's degree.
17.0% of adults in Marina del Rey completed master's degree.
8.0% of adults in Marina del Rey completed professional degree.
3.0% of adults in Marina del Rey completed doctorate degree.
| Education | Marina del Rey | CA | USA |
|---|---|---|---|
| < 9th Grade | 0.0% | 9.0% | 4.0% |
| 9-12th Grade | 0.0% | 7.0% | 6.0% |
| High School / GED | 6.0% | 20.0% | 26.0% |
| Some College | 13.0% | 20.0% | 20.0% |
| Associate's Degree | 8.0% | 8.0% | 9.0% |
| Bachelor's Degree | 45.0% | 22.0% | 21.0% |
| Master's Degree | 17.0% | 9.0% | 10.0% |
| Professional Degree | 8.0% | 3.0% | 2.0% |
| Doctorate Degree | 3.0% | 2.0% | 2.0% |
Household Income For Marina del Rey, California
0.4% of households in Marina del Rey earn Less than $10,000.
0.0% of households in Marina del Rey earn $10,000 to $14,999.
3.3% of households in Marina del Rey earn $15,000 to $24,999.
7.9% of households in Marina del Rey earn $25,000 to $34,999.
5.3% of households in Marina del Rey earn $35,000 to $49,999.
7.9% of households in Marina del Rey earn $50,000 to $74,999.
8.3% of households in Marina del Rey earn $75,000 to $99,999.
23.0% of households in Marina del Rey earn $100,000 to $149,999.
15.3% of households in Marina del Rey earn $150,000 to $199,999.
28.5% of households in Marina del Rey earn $200,000 or more.
| Income | Marina del Rey | CA | USA |
|---|---|---|---|
| Less than $10,000 | 0.4% | 4.4% | 4.9% |
| $10,000 to $14,999 | 0.0% | 3.2% | 3.8% |
| $15,000 to $24,999 | 3.3% | 5.6% | 7.0% |
| $25,000 to $34,999 | 7.9% | 6.0% | 7.4% |
| $35,000 to $49,999 | 5.3% | 8.7% | 10.7% |
| $50,000 to $74,999 | 7.9% | 13.7% | 16.1% |
| $75,000 to $99,999 | 8.3% | 12.0% | 12.8% |
| $100,000 to $149,999 | 23.0% | 17.8% | 17.1% |
| $150,000 to $199,999 | 15.3% | 10.7% | 8.8% |
| $200,000 or more | 28.5% | 17.9% | 11.4% |


