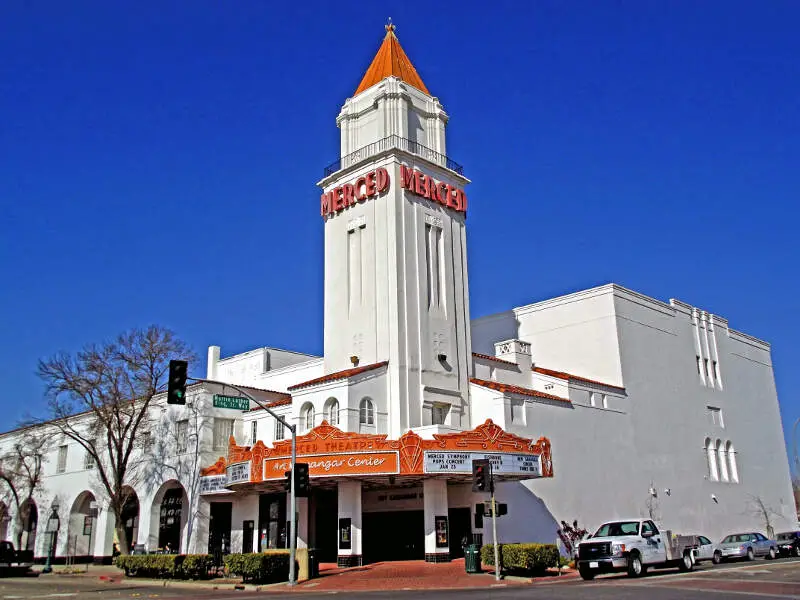
Merced, CA
Demographics And Statistics
Living In Merced, California Summary
Life in Merced research summary. HomeSnacks has been using Saturday Night Science to research the quality of life in Merced over the past nine years using Census, FBI, Zillow, and other primary data sources. Based on the most recently available data, we found the following about life in Merced:
The population in Merced is 87,686.
The median home value in Merced is $376,996.
The median income in Merced is $59,233.
The cost of living in Merced is 103 which is 1.0x higher than the national average.
The median rent in Merced is $1,197.
The unemployment rate in Merced is 12.6%.
The poverty rate in Merced is 25.2%.
The average high in Merced is 75.3° and the average low is 49.1°.
Merced SnackAbility
Overall SnackAbility
Merced, CA Crime Report
Crime in Merced summary. We use data from the FBI to determine the crime rates in Merced. Key points include:
There were 3,266 total crimes in Merced in the last reporting year.
The overall crime rate per 100,000 people in Merced is 3,542.6 / 100k people.
The violent crime rate per 100,000 people in Merced is 800.5 / 100k people.
The property crime rate per 100,000 people in Merced is 2,742.1 / 100k people.
Overall, crime in Merced is 52.42% above the national average.
Total Crimes
Above National Average
Crime In Merced Comparison Table
| Statistic | Count Raw |
Merced / 100k People |
California / 100k People |
National / 100k People |
|---|---|---|---|---|
| Total Crimes Per 100K | 3,266 | 3,542.6 | 2,581.0 | 2,324.2 |
| Violent Crime | 738 | 800.5 | 442.0 | 369.8 |
| Murder | 6 | 6.5 | 5.6 | 6.3 |
| Robbery | 154 | 167.0 | 113.6 | 66.1 |
| Aggravated Assault | 471 | 510.9 | 288.7 | 268.2 |
| Property Crime | 2,528 | 2,742.1 | 2,138.9 | 1,954.4 |
| Burglary | 381 | 413.3 | 369.7 | 269.8 |
| Larceny | 1,722 | 1,867.9 | 1,341.7 | 1,401.9 |
| Car Theft | 425 | 461.0 | 427.6 | 282.7 |
Merced, CA Cost Of Living
Cost of living in Merced summary. We use data on the cost of living to determine how expensive it is to live in Merced. Real estate prices drive most of the variance in cost of living around California. Key points include:
The cost of living in Merced is 103 with 100 being average.
The cost of living in Merced is 1.0x higher than the national average.
The median home value in Merced is $376,996.
The median income in Merced is $59,233.
Merced's Overall Cost Of Living
Higher Than The National Average
Cost Of Living In Merced Comparison Table
| Living Expense | Merced | California | National Average | |
|---|---|---|---|---|
| Overall | 103 | 139 | 100 | |
| Services | 99 | 110 | 100 | |
| Groceries | 106 | 112 | 100 | |
| Health | 97 | 109 | 100 | |
| Housing | 93 | 204 | 100 | |
| Transportation | 125 | 126 | 100 | |
| Utilities | 141 | 124 | 100 | |
Merced, CA Weather
The average high in Merced is 75.3° and the average low is 49.1°.
There are 36.8 days of precipitation each year.
Expect an average of 12.3 inches of precipitation each year with 0.0 inches of snow.
| Stat | Merced |
|---|---|
| Average Annual High | 75.3 |
| Average Annual Low | 49.1 |
| Annual Precipitation Days | 36.8 |
| Average Annual Precipitation | 12.3 |
| Average Annual Snowfall | 0.0 |
Average High
Days of Rain
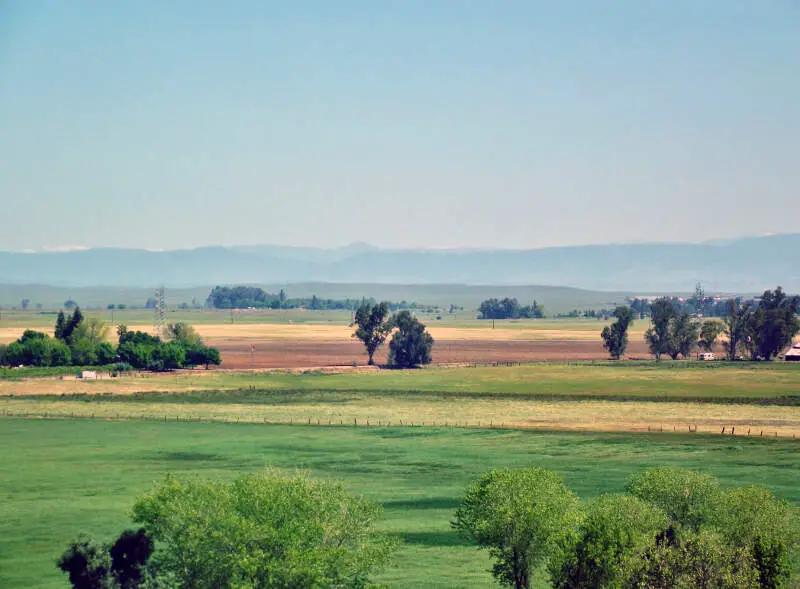
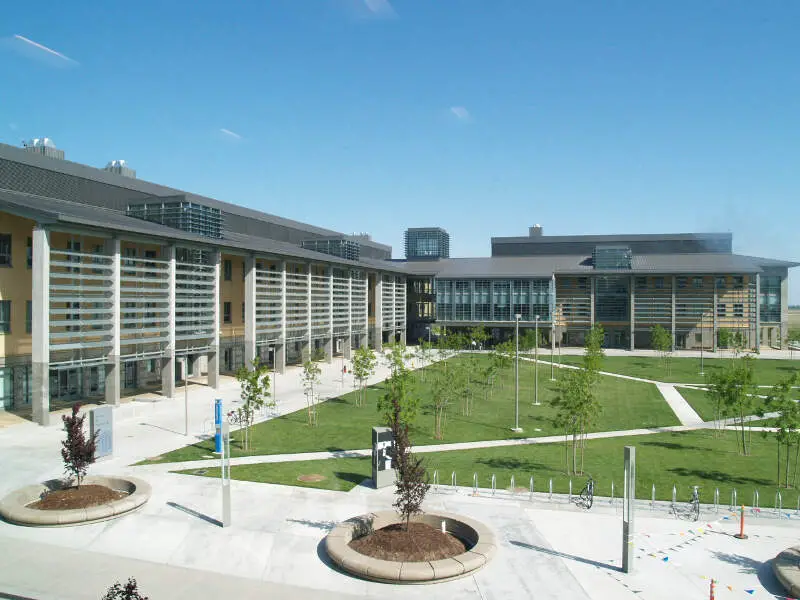
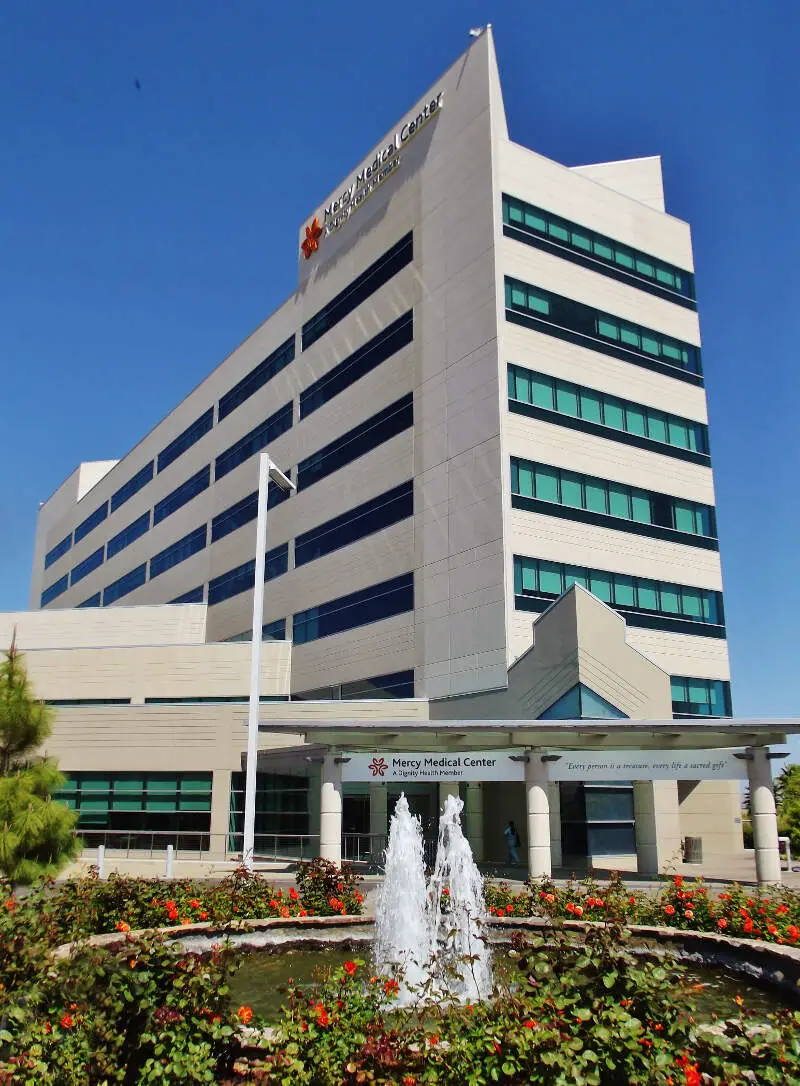
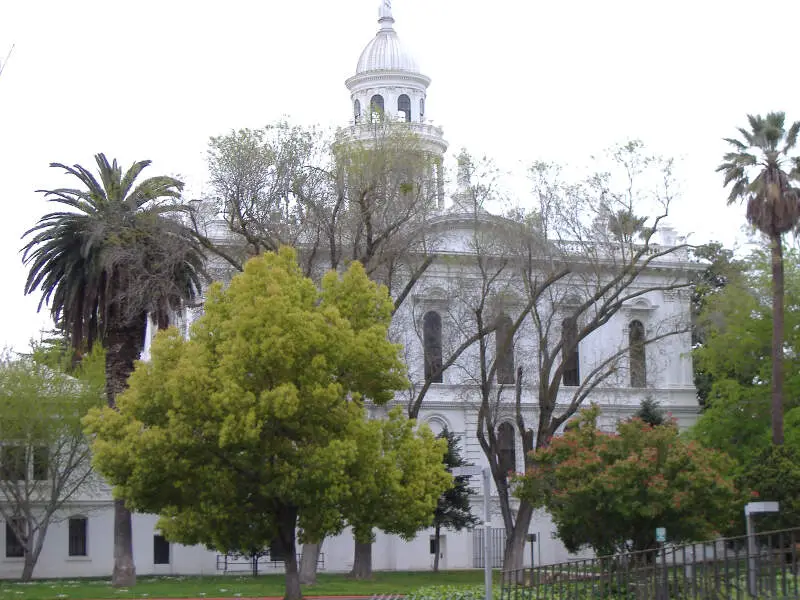
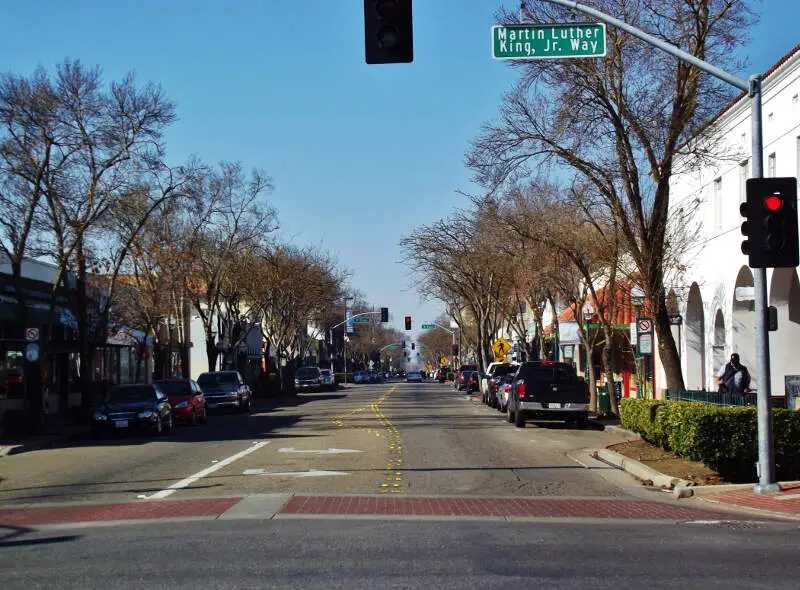
Merced, CA Photos
1 Reviews & Comments About Merced
/5

SophiatheWolfchild -
I live in the Vally of California it's called Merced and I am surprised they didn't put my town in it 'What's Merced' well Merced is the gateway to Yosemite
Rankings for Merced in California


Locations Around Merced
Map Of Merced, CA
Best Places Around Merced
Delhi, CA
Population 10,896
Livingston, CA
Population 14,344
Atwater, CA
Population 31,841
Chowchilla, CA
Population 18,772
Winton, CA
Population 11,986
Merced Demographics And Statistics
Population over time in Merced
The current population in Merced is 87,686. The population has increased 13.8% from 2010.
| Year | Population | % Change |
|---|---|---|
| 2022 | 87,686 | 6.6% |
| 2021 | 82,289 | 0.3% |
| 2020 | 82,008 | 0.7% |
| 2019 | 81,461 | 0.4% |
| 2018 | 81,120 | 0.8% |
| 2017 | 80,490 | 1.1% |
| 2016 | 79,639 | 0.9% |
| 2015 | 78,953 | 1.1% |
| 2014 | 78,111 | 1.3% |
| 2013 | 77,080 | - |
Race / Ethnicity in Merced
Merced is:
23.1% White with 20,296 White residents.
4.1% African American with 3,565 African American residents.
0.4% American Indian with 341 American Indian residents.
10.0% Asian with 8,763 Asian residents.
0.3% Hawaiian with 293 Hawaiian residents.
0.3% Other with 228 Other residents.
2.8% Two Or More with 2,418 Two Or More residents.
59.1% Hispanic with 51,782 Hispanic residents.
| Race | Merced | CA | USA |
|---|---|---|---|
| White | 23.1% | 35.2% | 58.9% |
| African American | 4.1% | 5.3% | 12.1% |
| American Indian | 0.4% | 0.3% | 0.6% |
| Asian | 10.0% | 14.9% | 5.7% |
| Hawaiian | 0.3% | 0.3% | 0.2% |
| Other | 0.3% | 0.4% | 0.4% |
| Two Or More | 2.8% | 3.8% | 3.5% |
| Hispanic | 59.1% | 39.7% | 18.7% |
Gender in Merced
Merced is 50.4% female with 44,205 female residents.
Merced is 49.6% male with 43,481 male residents.
| Gender | Merced | CA | USA |
|---|---|---|---|
| Female | 50.4% | 49.9% | 50.4% |
| Male | 49.6% | 50.1% | 49.6% |
Highest level of educational attainment in Merced for adults over 25
12.0% of adults in Merced completed < 9th grade.
11.0% of adults in Merced completed 9-12th grade.
26.0% of adults in Merced completed high school / ged.
24.0% of adults in Merced completed some college.
10.0% of adults in Merced completed associate's degree.
11.0% of adults in Merced completed bachelor's degree.
4.0% of adults in Merced completed master's degree.
1.0% of adults in Merced completed professional degree.
1.0% of adults in Merced completed doctorate degree.
| Education | Merced | CA | USA |
|---|---|---|---|
| < 9th Grade | 12.0% | 9.0% | 4.0% |
| 9-12th Grade | 11.0% | 7.0% | 6.0% |
| High School / GED | 26.0% | 20.0% | 26.0% |
| Some College | 24.0% | 20.0% | 20.0% |
| Associate's Degree | 10.0% | 8.0% | 9.0% |
| Bachelor's Degree | 11.0% | 22.0% | 21.0% |
| Master's Degree | 4.0% | 9.0% | 10.0% |
| Professional Degree | 1.0% | 3.0% | 2.0% |
| Doctorate Degree | 1.0% | 2.0% | 2.0% |
Household Income For Merced, California
7.2% of households in Merced earn Less than $10,000.
5.2% of households in Merced earn $10,000 to $14,999.
9.4% of households in Merced earn $15,000 to $24,999.
8.0% of households in Merced earn $25,000 to $34,999.
12.8% of households in Merced earn $35,000 to $49,999.
18.3% of households in Merced earn $50,000 to $74,999.
13.2% of households in Merced earn $75,000 to $99,999.
14.5% of households in Merced earn $100,000 to $149,999.
5.8% of households in Merced earn $150,000 to $199,999.
5.6% of households in Merced earn $200,000 or more.
| Income | Merced | CA | USA |
|---|---|---|---|
| Less than $10,000 | 7.2% | 4.4% | 4.9% |
| $10,000 to $14,999 | 5.2% | 3.2% | 3.8% |
| $15,000 to $24,999 | 9.4% | 5.6% | 7.0% |
| $25,000 to $34,999 | 8.0% | 6.0% | 7.4% |
| $35,000 to $49,999 | 12.8% | 8.7% | 10.7% |
| $50,000 to $74,999 | 18.3% | 13.7% | 16.1% |
| $75,000 to $99,999 | 13.2% | 12.0% | 12.8% |
| $100,000 to $149,999 | 14.5% | 17.8% | 17.1% |
| $150,000 to $199,999 | 5.8% | 10.7% | 8.8% |
| $200,000 or more | 5.6% | 17.9% | 11.4% |


