Mill Valley, CA
Demographics And Statistics
Living In Mill Valley, California Summary
Life in Mill Valley research summary. HomeSnacks has been using Saturday Night Science to research the quality of life in Mill Valley over the past nine years using Census, FBI, Zillow, and other primary data sources. Based on the most recently available data, we found the following about life in Mill Valley:
The population in Mill Valley is 14,199.
The median home value in Mill Valley is $2,043,408.
The median income in Mill Valley is $202,986.
The cost of living in Mill Valley is 247 which is 2.5x higher than the national average.
The median rent in Mill Valley is $2,988.
The unemployment rate in Mill Valley is 7.4%.
The poverty rate in Mill Valley is 4.6%.
The average high in Mill Valley is 67.1° and the average low is 48.0°.
Mill Valley SnackAbility
Overall SnackAbility
Mill Valley, CA Crime Report
Crime in Mill Valley summary. We use data from the FBI to determine the crime rates in Mill Valley. Key points include:
There were 165 total crimes in Mill Valley in the last reporting year.
The overall crime rate per 100,000 people in Mill Valley is 1,176.6 / 100k people.
The violent crime rate per 100,000 people in Mill Valley is 64.2 / 100k people.
The property crime rate per 100,000 people in Mill Valley is 1,112.5 / 100k people.
Overall, crime in Mill Valley is -49.37% below the national average.
Total Crimes
Below National Average
Crime In Mill Valley Comparison Table
| Statistic | Count Raw |
Mill Valley / 100k People |
California / 100k People |
National / 100k People |
|---|---|---|---|---|
| Total Crimes Per 100K | 165 | 1,176.6 | 2,581.0 | 2,324.2 |
| Violent Crime | 9 | 64.2 | 442.0 | 369.8 |
| Murder | 0 | 0.0 | 5.6 | 6.3 |
| Robbery | 2 | 14.3 | 113.6 | 66.1 |
| Aggravated Assault | 7 | 49.9 | 288.7 | 268.2 |
| Property Crime | 156 | 1,112.5 | 2,138.9 | 1,954.4 |
| Burglary | 30 | 213.9 | 369.7 | 269.8 |
| Larceny | 113 | 805.8 | 1,341.7 | 1,401.9 |
| Car Theft | 13 | 92.7 | 427.6 | 282.7 |
Mill Valley, CA Cost Of Living
Cost of living in Mill Valley summary. We use data on the cost of living to determine how expensive it is to live in Mill Valley. Real estate prices drive most of the variance in cost of living around California. Key points include:
The cost of living in Mill Valley is 247 with 100 being average.
The cost of living in Mill Valley is 2.5x higher than the national average.
The median home value in Mill Valley is $2,043,408.
The median income in Mill Valley is $202,986.
Mill Valley's Overall Cost Of Living
Higher Than The National Average
Cost Of Living In Mill Valley Comparison Table
| Living Expense | Mill Valley | California | National Average | |
|---|---|---|---|---|
| Overall | 247 | 139 | 100 | |
| Services | 124 | 110 | 100 | |
| Groceries | 129 | 112 | 100 | |
| Health | 129 | 109 | 100 | |
| Housing | 518 | 204 | 100 | |
| Transportation | 139 | 126 | 100 | |
| Utilities | 132 | 124 | 100 | |
Mill Valley, CA Weather
The average high in Mill Valley is 67.1° and the average low is 48.0°.
There are 49.9 days of precipitation each year.
Expect an average of 36.2 inches of precipitation each year with 0.0 inches of snow.
| Stat | Mill Valley |
|---|---|
| Average Annual High | 67.1 |
| Average Annual Low | 48.0 |
| Annual Precipitation Days | 49.9 |
| Average Annual Precipitation | 36.2 |
| Average Annual Snowfall | 0.0 |
Average High
Days of Rain
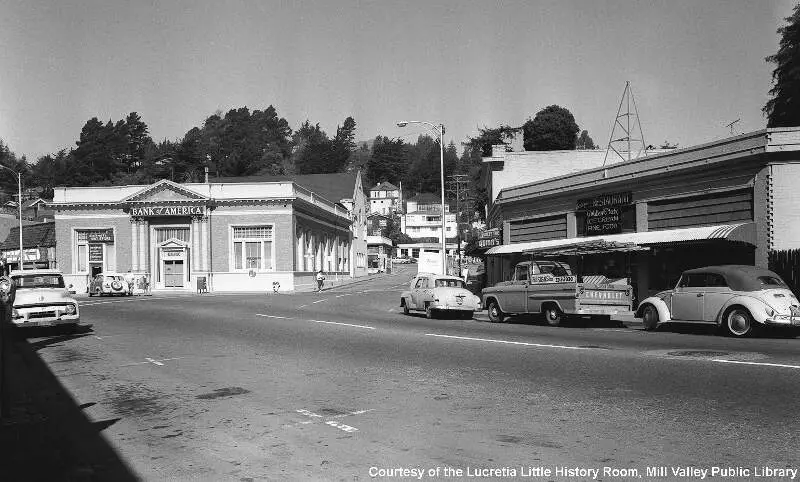
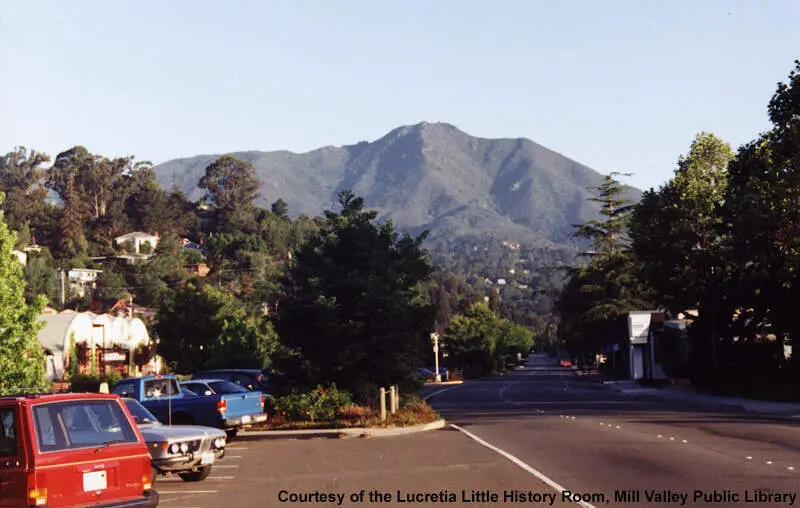
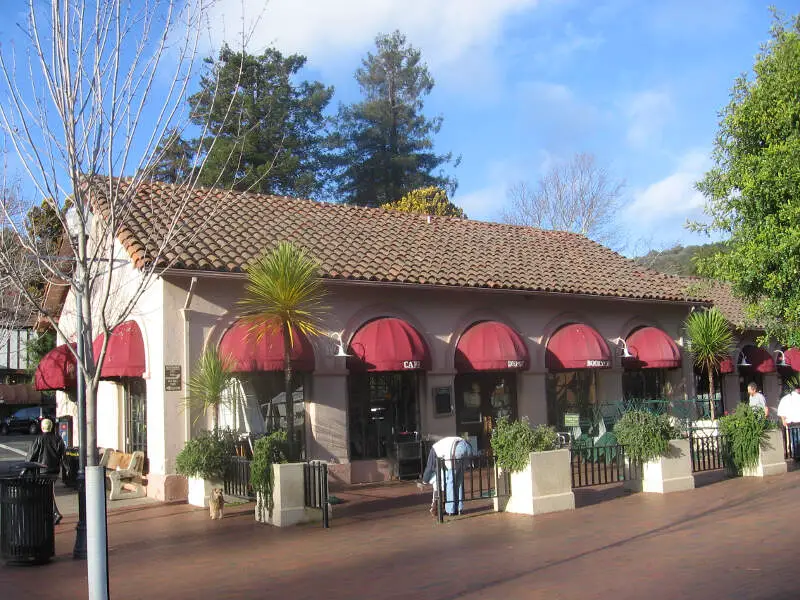
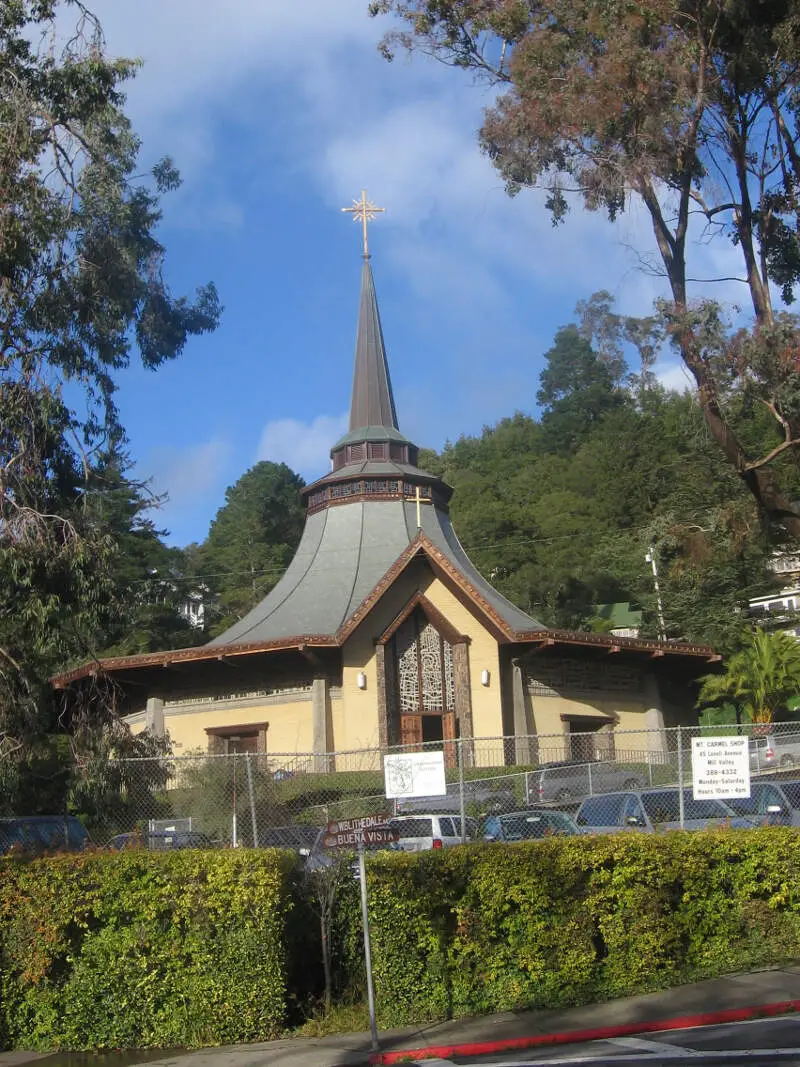
Mill Valley, CA Photos


1 Reviews & Comments About Mill Valley
/5

Jade -
OMG I live in MILL VALLEY!!!! Lol. We are pretty s****y, but if you're s****y, you must have a reason why. It's so pretty here! And most people are really nice too.
Rankings for Mill Valley in California


Locations Around Mill Valley
Map Of Mill Valley, CA
Best Places Around Mill Valley
Piedmont, CA
Population 11,161
Kensington, CA
Population 5,309
Lucas Valley-Marinwood, CA
Population 6,334
Fairfax, CA
Population 7,567
South San Francisco, CA
Population 65,596
Kentfield, CA
Population 7,410
Hercules, CA
Population 26,041
San Anselmo, CA
Population 12,761
Larkspur, CA
Population 12,969
Corte Madera, CA
Population 10,155
Mill Valley Demographics And Statistics
Population over time in Mill Valley
The current population in Mill Valley is 14,199. The population has increased 3.6% from 2010.
| Year | Population | % Change |
|---|---|---|
| 2022 | 14,199 | -1.0% |
| 2021 | 14,343 | -0.3% |
| 2020 | 14,392 | 0.5% |
| 2019 | 14,318 | 0.5% |
| 2018 | 14,243 | 0.5% |
| 2017 | 14,178 | 0.9% |
| 2016 | 14,046 | 0.8% |
| 2015 | 13,931 | 0.9% |
| 2014 | 13,810 | 0.8% |
| 2013 | 13,702 | - |
Race / Ethnicity in Mill Valley
Mill Valley is:
82.7% White with 11,738 White residents.
1.7% African American with 245 African American residents.
0.0% American Indian with 0 American Indian residents.
7.8% Asian with 1,104 Asian residents.
0.0% Hawaiian with 0 Hawaiian residents.
1.0% Other with 145 Other residents.
4.1% Two Or More with 583 Two Or More residents.
2.7% Hispanic with 384 Hispanic residents.
| Race | Mill Valley | CA | USA |
|---|---|---|---|
| White | 82.7% | 35.2% | 58.9% |
| African American | 1.7% | 5.3% | 12.1% |
| American Indian | 0.0% | 0.3% | 0.6% |
| Asian | 7.8% | 14.9% | 5.7% |
| Hawaiian | 0.0% | 0.3% | 0.2% |
| Other | 1.0% | 0.4% | 0.4% |
| Two Or More | 4.1% | 3.8% | 3.5% |
| Hispanic | 2.7% | 39.7% | 18.7% |
Gender in Mill Valley
Mill Valley is 53.0% female with 7,519 female residents.
Mill Valley is 47.0% male with 6,679 male residents.
| Gender | Mill Valley | CA | USA |
|---|---|---|---|
| Female | 53.0% | 49.9% | 50.4% |
| Male | 47.0% | 50.1% | 49.6% |
Highest level of educational attainment in Mill Valley for adults over 25
0.0% of adults in Mill Valley completed < 9th grade.
1.0% of adults in Mill Valley completed 9-12th grade.
7.0% of adults in Mill Valley completed high school / ged.
11.0% of adults in Mill Valley completed some college.
5.0% of adults in Mill Valley completed associate's degree.
39.0% of adults in Mill Valley completed bachelor's degree.
23.0% of adults in Mill Valley completed master's degree.
10.0% of adults in Mill Valley completed professional degree.
4.0% of adults in Mill Valley completed doctorate degree.
| Education | Mill Valley | CA | USA |
|---|---|---|---|
| < 9th Grade | 0.0% | 9.0% | 4.0% |
| 9-12th Grade | 1.0% | 7.0% | 6.0% |
| High School / GED | 7.0% | 20.0% | 26.0% |
| Some College | 11.0% | 20.0% | 20.0% |
| Associate's Degree | 5.0% | 8.0% | 9.0% |
| Bachelor's Degree | 39.0% | 22.0% | 21.0% |
| Master's Degree | 23.0% | 9.0% | 10.0% |
| Professional Degree | 10.0% | 3.0% | 2.0% |
| Doctorate Degree | 4.0% | 2.0% | 2.0% |
Household Income For Mill Valley, California
3.2% of households in Mill Valley earn Less than $10,000.
2.0% of households in Mill Valley earn $10,000 to $14,999.
1.7% of households in Mill Valley earn $15,000 to $24,999.
1.8% of households in Mill Valley earn $25,000 to $34,999.
1.9% of households in Mill Valley earn $35,000 to $49,999.
7.5% of households in Mill Valley earn $50,000 to $74,999.
6.8% of households in Mill Valley earn $75,000 to $99,999.
10.6% of households in Mill Valley earn $100,000 to $149,999.
14.4% of households in Mill Valley earn $150,000 to $199,999.
50.1% of households in Mill Valley earn $200,000 or more.
| Income | Mill Valley | CA | USA |
|---|---|---|---|
| Less than $10,000 | 3.2% | 4.4% | 4.9% |
| $10,000 to $14,999 | 2.0% | 3.2% | 3.8% |
| $15,000 to $24,999 | 1.7% | 5.6% | 7.0% |
| $25,000 to $34,999 | 1.8% | 6.0% | 7.4% |
| $35,000 to $49,999 | 1.9% | 8.7% | 10.7% |
| $50,000 to $74,999 | 7.5% | 13.7% | 16.1% |
| $75,000 to $99,999 | 6.8% | 12.0% | 12.8% |
| $100,000 to $149,999 | 10.6% | 17.8% | 17.1% |
| $150,000 to $199,999 | 14.4% | 10.7% | 8.8% |
| $200,000 or more | 50.1% | 17.9% | 11.4% |


