Pacifica, CA
Demographics And Statistics
Living In Pacifica, California Summary
Life in Pacifica research summary. HomeSnacks has been using Saturday Night Science to research the quality of life in Pacifica over the past nine years using Census, FBI, Zillow, and other primary data sources. Based on the most recently available data, we found the following about life in Pacifica:
The population in Pacifica is 38,048.
The median home value in Pacifica is $1,246,502.
The median income in Pacifica is $151,849.
The cost of living in Pacifica is 187 which is 1.9x higher than the national average.
The median rent in Pacifica is $2,939.
The unemployment rate in Pacifica is 3.8%.
The poverty rate in Pacifica is 5.6%.
The average high in Pacifica is 66.7° and the average low is 49.1°.
Pacifica SnackAbility
Overall SnackAbility
Pacifica, CA Crime Report
Crime in Pacifica summary. We use data from the FBI to determine the crime rates in Pacifica. Key points include:
There were 620 total crimes in Pacifica in the last reporting year.
The overall crime rate per 100,000 people in Pacifica is 1,734.7 / 100k people.
The violent crime rate per 100,000 people in Pacifica is 246.2 / 100k people.
The property crime rate per 100,000 people in Pacifica is 1,488.4 / 100k people.
Overall, crime in Pacifica is -25.37% below the national average.
Total Crimes
Below National Average
Crime In Pacifica Comparison Table
| Statistic | Count Raw |
Pacifica / 100k People |
California / 100k People |
National / 100k People |
|---|---|---|---|---|
| Total Crimes Per 100K | 620 | 1,734.7 | 2,581.0 | 2,324.2 |
| Violent Crime | 88 | 246.2 | 442.0 | 369.8 |
| Murder | 0 | 0.0 | 5.6 | 6.3 |
| Robbery | 10 | 28.0 | 113.6 | 66.1 |
| Aggravated Assault | 63 | 176.3 | 288.7 | 268.2 |
| Property Crime | 532 | 1,488.4 | 2,138.9 | 1,954.4 |
| Burglary | 86 | 240.6 | 369.7 | 269.8 |
| Larceny | 385 | 1,077.2 | 1,341.7 | 1,401.9 |
| Car Theft | 61 | 170.7 | 427.6 | 282.7 |
Pacifica, CA Cost Of Living
Cost of living in Pacifica summary. We use data on the cost of living to determine how expensive it is to live in Pacifica. Real estate prices drive most of the variance in cost of living around California. Key points include:
The cost of living in Pacifica is 187 with 100 being average.
The cost of living in Pacifica is 1.9x higher than the national average.
The median home value in Pacifica is $1,246,502.
The median income in Pacifica is $151,849.
Pacifica's Overall Cost Of Living
Higher Than The National Average
Cost Of Living In Pacifica Comparison Table
| Living Expense | Pacifica | California | National Average | |
|---|---|---|---|---|
| Overall | 187 | 139 | 100 | |
| Services | 121 | 110 | 100 | |
| Groceries | 129 | 112 | 100 | |
| Health | 132 | 109 | 100 | |
| Housing | 320 | 204 | 100 | |
| Transportation | 136 | 126 | 100 | |
| Utilities | 130 | 124 | 100 | |
Pacifica, CA Weather
The average high in Pacifica is 66.7° and the average low is 49.1°.
There are 42.7 days of precipitation each year.
Expect an average of 24.5 inches of precipitation each year with 0.0 inches of snow.
| Stat | Pacifica |
|---|---|
| Average Annual High | 66.7 |
| Average Annual Low | 49.1 |
| Annual Precipitation Days | 42.7 |
| Average Annual Precipitation | 24.5 |
| Average Annual Snowfall | 0.0 |
Average High
Days of Rain
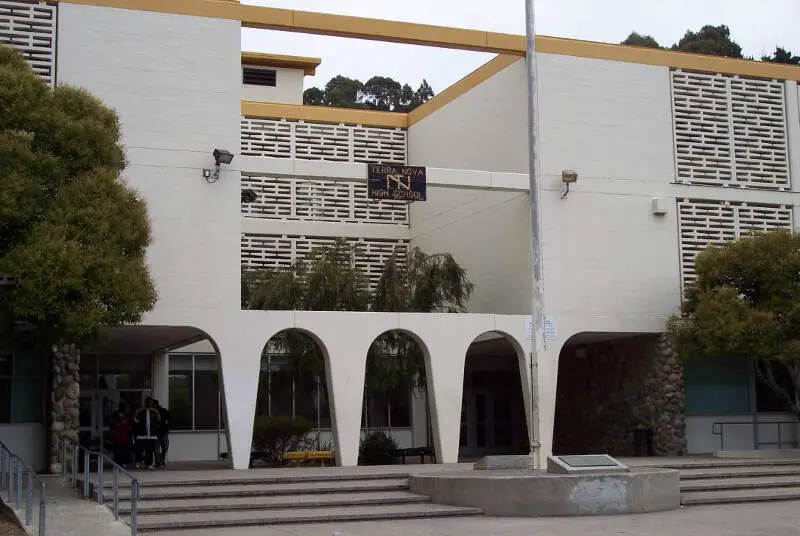
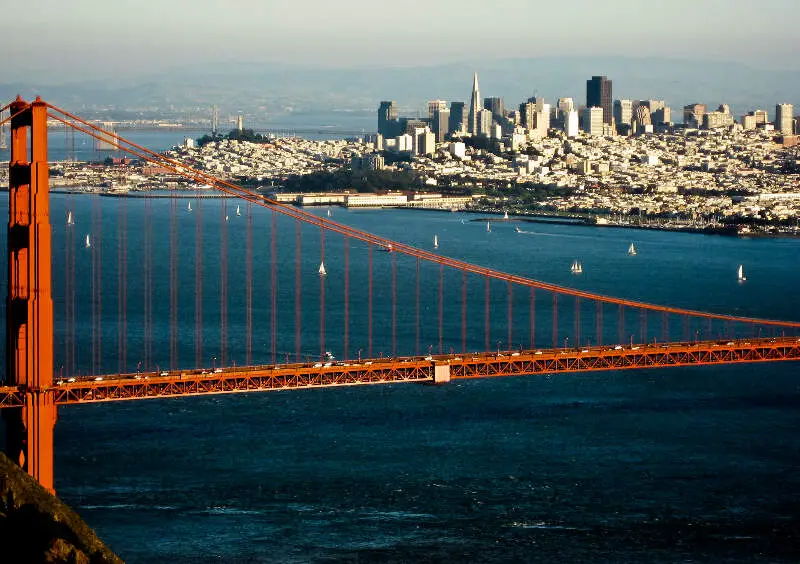
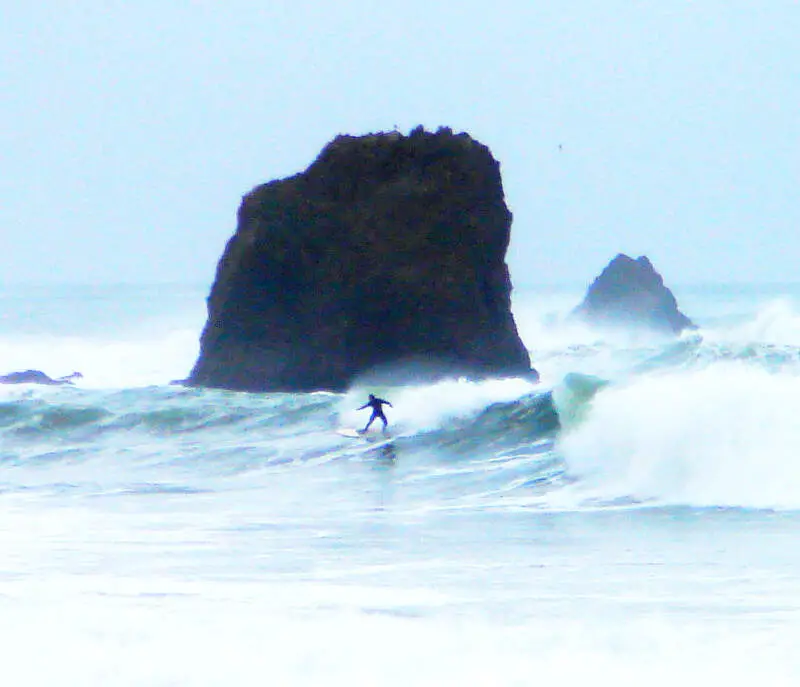
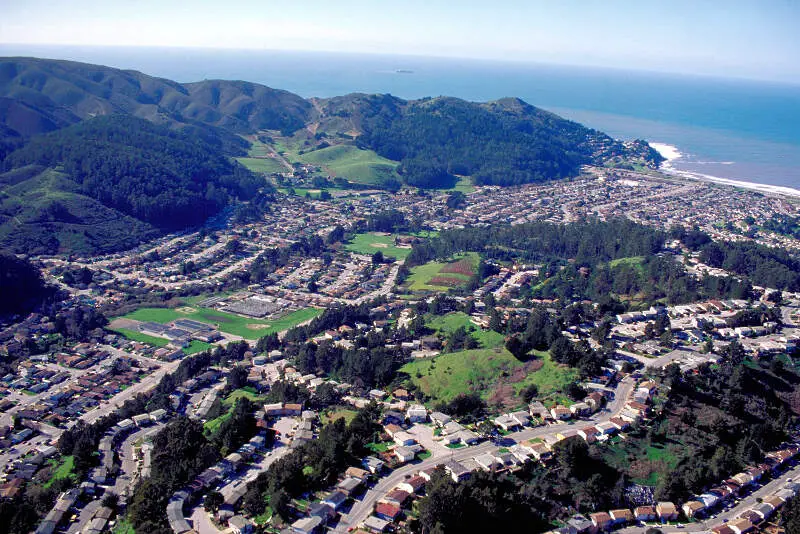
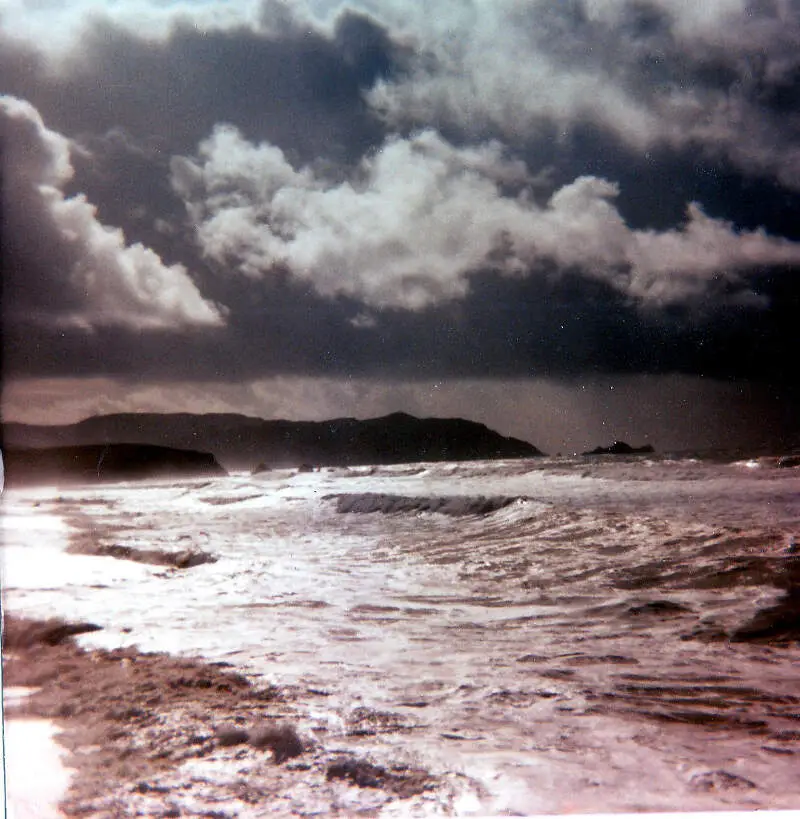
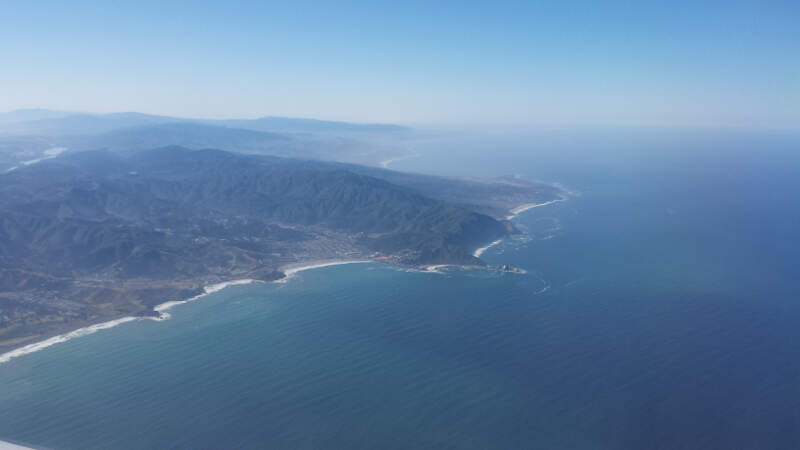
Pacifica, CA Photos

Rankings for Pacifica in California


Locations Around Pacifica
Map Of Pacifica, CA
Best Places Around Pacifica
San Carlos, CA
Population 30,490
San Lorenzo, CA
Population 29,759
San Mateo, CA
Population 104,165
San Bruno, CA
Population 43,218
Belmont, CA
Population 27,820
North Fair Oaks, CA
Population 13,718
Millbrae, CA
Population 22,825
South San Francisco, CA
Population 65,596
Burlingame, CA
Population 30,995
Half Moon Bay, CA
Population 11,633
Pacifica Demographics And Statistics
Population over time in Pacifica
The current population in Pacifica is 38,048. The population has increased 3.4% from 2010.
| Year | Population | % Change |
|---|---|---|
| 2022 | 38,048 | -2.6% |
| 2021 | 39,065 | -0.2% |
| 2020 | 39,141 | 0.8% |
| 2019 | 38,844 | 0.5% |
| 2018 | 38,665 | 1.0% |
| 2017 | 38,283 | 1.2% |
| 2016 | 37,825 | 1.1% |
| 2015 | 37,413 | 1.0% |
| 2014 | 37,043 | 0.6% |
| 2013 | 36,805 | - |
Race / Ethnicity in Pacifica
Pacifica is:
50.9% White with 19,368 White residents.
2.0% African American with 760 African American residents.
0.0% American Indian with 16 American Indian residents.
21.0% Asian with 8,005 Asian residents.
1.1% Hawaiian with 400 Hawaiian residents.
0.8% Other with 315 Other residents.
5.9% Two Or More with 2,237 Two Or More residents.
18.3% Hispanic with 6,947 Hispanic residents.
| Race | Pacifica | CA | USA |
|---|---|---|---|
| White | 50.9% | 35.2% | 58.9% |
| African American | 2.0% | 5.3% | 12.1% |
| American Indian | 0.0% | 0.3% | 0.6% |
| Asian | 21.0% | 14.9% | 5.7% |
| Hawaiian | 1.1% | 0.3% | 0.2% |
| Other | 0.8% | 0.4% | 0.4% |
| Two Or More | 5.9% | 3.8% | 3.5% |
| Hispanic | 18.3% | 39.7% | 18.7% |
Gender in Pacifica
Pacifica is 50.0% female with 19,015 female residents.
Pacifica is 50.0% male with 19,033 male residents.
| Gender | Pacifica | CA | USA |
|---|---|---|---|
| Female | 50.0% | 49.9% | 50.4% |
| Male | 50.0% | 50.1% | 49.6% |
Highest level of educational attainment in Pacifica for adults over 25
2.0% of adults in Pacifica completed < 9th grade.
2.0% of adults in Pacifica completed 9-12th grade.
16.0% of adults in Pacifica completed high school / ged.
22.0% of adults in Pacifica completed some college.
10.0% of adults in Pacifica completed associate's degree.
30.0% of adults in Pacifica completed bachelor's degree.
12.0% of adults in Pacifica completed master's degree.
3.0% of adults in Pacifica completed professional degree.
3.0% of adults in Pacifica completed doctorate degree.
| Education | Pacifica | CA | USA |
|---|---|---|---|
| < 9th Grade | 2.0% | 9.0% | 4.0% |
| 9-12th Grade | 2.0% | 7.0% | 6.0% |
| High School / GED | 16.0% | 20.0% | 26.0% |
| Some College | 22.0% | 20.0% | 20.0% |
| Associate's Degree | 10.0% | 8.0% | 9.0% |
| Bachelor's Degree | 30.0% | 22.0% | 21.0% |
| Master's Degree | 12.0% | 9.0% | 10.0% |
| Professional Degree | 3.0% | 3.0% | 2.0% |
| Doctorate Degree | 3.0% | 2.0% | 2.0% |
Household Income For Pacifica, California
2.2% of households in Pacifica earn Less than $10,000.
1.5% of households in Pacifica earn $10,000 to $14,999.
2.8% of households in Pacifica earn $15,000 to $24,999.
3.2% of households in Pacifica earn $25,000 to $34,999.
4.3% of households in Pacifica earn $35,000 to $49,999.
11.4% of households in Pacifica earn $50,000 to $74,999.
8.9% of households in Pacifica earn $75,000 to $99,999.
15.3% of households in Pacifica earn $100,000 to $149,999.
17.6% of households in Pacifica earn $150,000 to $199,999.
32.9% of households in Pacifica earn $200,000 or more.
| Income | Pacifica | CA | USA |
|---|---|---|---|
| Less than $10,000 | 2.2% | 4.4% | 4.9% |
| $10,000 to $14,999 | 1.5% | 3.2% | 3.8% |
| $15,000 to $24,999 | 2.8% | 5.6% | 7.0% |
| $25,000 to $34,999 | 3.2% | 6.0% | 7.4% |
| $35,000 to $49,999 | 4.3% | 8.7% | 10.7% |
| $50,000 to $74,999 | 11.4% | 13.7% | 16.1% |
| $75,000 to $99,999 | 8.9% | 12.0% | 12.8% |
| $100,000 to $149,999 | 15.3% | 17.8% | 17.1% |
| $150,000 to $199,999 | 17.6% | 10.7% | 8.8% |
| $200,000 or more | 32.9% | 17.9% | 11.4% |


