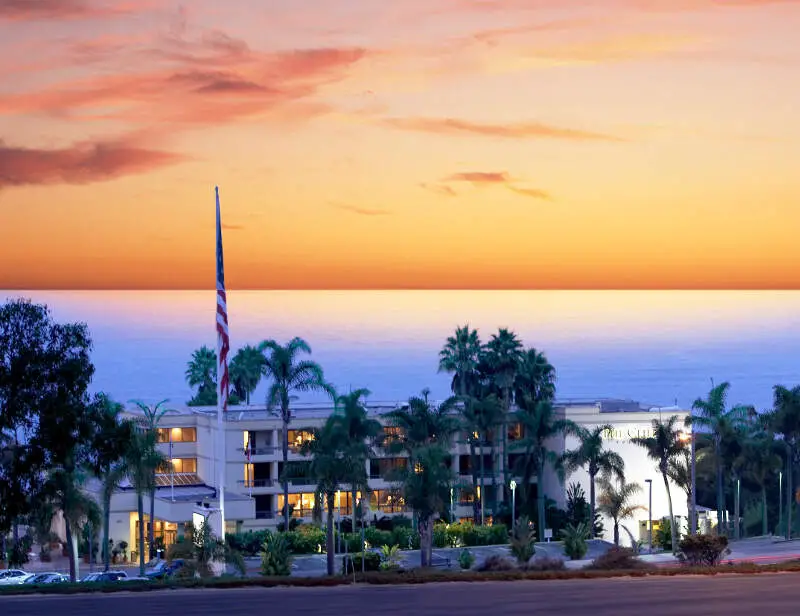
Pismo Beach, CA
Demographics And Statistics
Living In Pismo Beach, California Summary
Life in Pismo Beach research summary. HomeSnacks has been using Saturday Night Science to research the quality of life in Pismo Beach over the past nine years using Census, FBI, Zillow, and other primary data sources. Based on the most recently available data, we found the following about life in Pismo Beach:
The population in Pismo Beach is 8,050.
The median home value in Pismo Beach is $1,237,660.
The median income in Pismo Beach is $109,196.
The cost of living in Pismo Beach is 163 which is 1.6x higher than the national average.
The median rent in Pismo Beach is $2,199.
The unemployment rate in Pismo Beach is 2.7%.
The poverty rate in Pismo Beach is 7.9%.
The average high in Pismo Beach is 70.3° and the average low is 46.2°.
Pismo Beach SnackAbility
Overall SnackAbility
Pismo Beach, CA Crime Report
Crime in Pismo Beach summary. We use data from the FBI to determine the crime rates in Pismo Beach. Key points include:
There were 388 total crimes in Pismo Beach in the last reporting year.
The overall crime rate per 100,000 people in Pismo Beach is 4,840.9 / 100k people.
The violent crime rate per 100,000 people in Pismo Beach is 1,185.3 / 100k people.
The property crime rate per 100,000 people in Pismo Beach is 3,655.6 / 100k people.
Overall, crime in Pismo Beach is 108.28% above the national average.
Total Crimes
Above National Average
Crime In Pismo Beach Comparison Table
| Statistic | Count Raw |
Pismo Beach / 100k People |
California / 100k People |
National / 100k People |
|---|---|---|---|---|
| Total Crimes Per 100K | 388 | 4,840.9 | 2,581.0 | 2,324.2 |
| Violent Crime | 95 | 1,185.3 | 442.0 | 369.8 |
| Murder | 0 | 0.0 | 5.6 | 6.3 |
| Robbery | 8 | 99.8 | 113.6 | 66.1 |
| Aggravated Assault | 84 | 1,048.0 | 288.7 | 268.2 |
| Property Crime | 293 | 3,655.6 | 2,138.9 | 1,954.4 |
| Burglary | 31 | 386.8 | 369.7 | 269.8 |
| Larceny | 245 | 3,056.8 | 1,341.7 | 1,401.9 |
| Car Theft | 17 | 212.1 | 427.6 | 282.7 |
Pismo Beach, CA Cost Of Living
Cost of living in Pismo Beach summary. We use data on the cost of living to determine how expensive it is to live in Pismo Beach. Real estate prices drive most of the variance in cost of living around California. Key points include:
The cost of living in Pismo Beach is 163 with 100 being average.
The cost of living in Pismo Beach is 1.6x higher than the national average.
The median home value in Pismo Beach is $1,237,660.
The median income in Pismo Beach is $109,196.
Pismo Beach's Overall Cost Of Living
Higher Than The National Average
Cost Of Living In Pismo Beach Comparison Table
| Living Expense | Pismo Beach | California | National Average | |
|---|---|---|---|---|
| Overall | 163 | 139 | 100 | |
| Services | 104 | 110 | 100 | |
| Groceries | 109 | 112 | 100 | |
| Health | 103 | 109 | 100 | |
| Housing | 286 | 204 | 100 | |
| Transportation | 117 | 126 | 100 | |
| Utilities | 160 | 124 | 100 | |
Pismo Beach, CA Weather
The average high in Pismo Beach is 70.3° and the average low is 46.2°.
There are 31.0 days of precipitation each year.
Expect an average of 18.2 inches of precipitation each year with 0.0 inches of snow.
| Stat | Pismo Beach |
|---|---|
| Average Annual High | 70.3 |
| Average Annual Low | 46.2 |
| Annual Precipitation Days | 31.0 |
| Average Annual Precipitation | 18.2 |
| Average Annual Snowfall | 0.0 |
Average High
Days of Rain
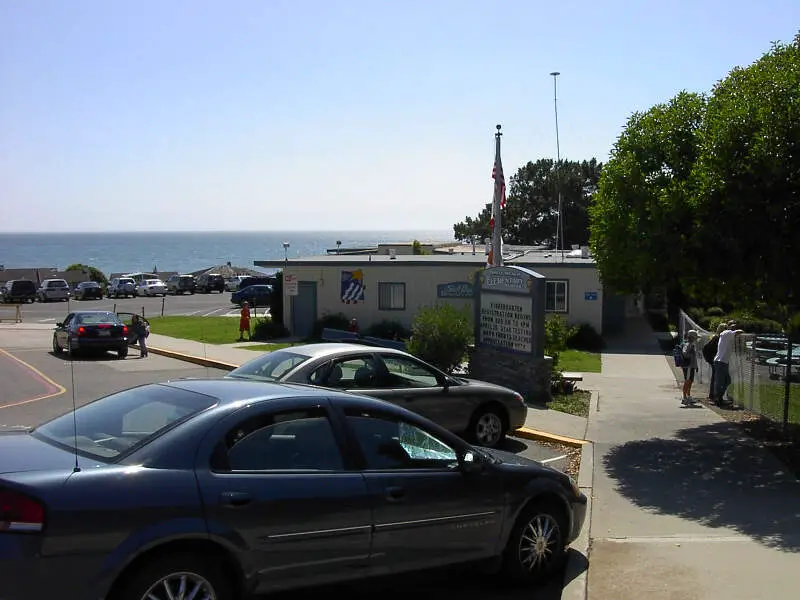
Pismo Beach, CA Photos
1 Reviews & Comments About Pismo Beach
/5

HomeSnacks User - 2018-08-20 19:39:16.160134
I love Pismo Beach. It has so much art integrated into the town, and so many friendly faces. The area is very clean, and a lot of options if you are wanting to find entertainment. The beach is very nice, and I love how they have the home of the Monarch butterflies there.
The prices are high, but worth it. The Butterfly Grove is a wonderful free place to visit, and I would highly recommend Pismo Yogurt. A lot of bike riders, and even rentals. Very pet friendly.
Rankings for Pismo Beach in California


Locations Around Pismo Beach
Map Of Pismo Beach, CA
Best Places Around Pismo Beach
Guadalupe, CA
Population 8,272
Nipomo, CA
Population 18,009
Grover Beach, CA
Population 12,757
Los Osos, CA
Population 15,523
San Luis Obispo, CA
Population 47,529
Arroyo Grande, CA
Population 18,435
Oceano, CA
Population 7,287
Morro Bay, CA
Population 10,766
Pismo Beach Demographics And Statistics
Population over time in Pismo Beach
The current population in Pismo Beach is 8,050. The population has increased 3.2% from 2010.
| Year | Population | % Change |
|---|---|---|
| 2022 | 8,050 | -0.8% |
| 2021 | 8,116 | 0.7% |
| 2020 | 8,060 | 1.0% |
| 2019 | 7,984 | 1.2% |
| 2018 | 7,890 | 1.3% |
| 2017 | 7,789 | 0.6% |
| 2016 | 7,746 | 0.3% |
| 2015 | 7,721 | -0.4% |
| 2014 | 7,753 | -0.6% |
| 2013 | 7,802 | - |
Race / Ethnicity in Pismo Beach
Pismo Beach is:
80.0% White with 6,444 White residents.
0.9% African American with 74 African American residents.
0.1% American Indian with 8 American Indian residents.
3.6% Asian with 293 Asian residents.
1.8% Hawaiian with 147 Hawaiian residents.
0.0% Other with 0 Other residents.
3.5% Two Or More with 279 Two Or More residents.
10.0% Hispanic with 805 Hispanic residents.
| Race | Pismo Beach | CA | USA |
|---|---|---|---|
| White | 80.0% | 35.2% | 58.9% |
| African American | 0.9% | 5.3% | 12.1% |
| American Indian | 0.1% | 0.3% | 0.6% |
| Asian | 3.6% | 14.9% | 5.7% |
| Hawaiian | 1.8% | 0.3% | 0.2% |
| Other | 0.0% | 0.4% | 0.4% |
| Two Or More | 3.5% | 3.8% | 3.5% |
| Hispanic | 10.0% | 39.7% | 18.7% |
Gender in Pismo Beach
Pismo Beach is 49.0% female with 3,947 female residents.
Pismo Beach is 51.0% male with 4,103 male residents.
| Gender | Pismo Beach | CA | USA |
|---|---|---|---|
| Female | 49.0% | 49.9% | 50.4% |
| Male | 51.0% | 50.1% | 49.6% |
Highest level of educational attainment in Pismo Beach for adults over 25
0.0% of adults in Pismo Beach completed < 9th grade.
3.0% of adults in Pismo Beach completed 9-12th grade.
13.0% of adults in Pismo Beach completed high school / ged.
26.0% of adults in Pismo Beach completed some college.
9.0% of adults in Pismo Beach completed associate's degree.
29.0% of adults in Pismo Beach completed bachelor's degree.
13.0% of adults in Pismo Beach completed master's degree.
5.0% of adults in Pismo Beach completed professional degree.
2.0% of adults in Pismo Beach completed doctorate degree.
| Education | Pismo Beach | CA | USA |
|---|---|---|---|
| < 9th Grade | 0.0% | 9.0% | 4.0% |
| 9-12th Grade | 3.0% | 7.0% | 6.0% |
| High School / GED | 13.0% | 20.0% | 26.0% |
| Some College | 26.0% | 20.0% | 20.0% |
| Associate's Degree | 9.0% | 8.0% | 9.0% |
| Bachelor's Degree | 29.0% | 22.0% | 21.0% |
| Master's Degree | 13.0% | 9.0% | 10.0% |
| Professional Degree | 5.0% | 3.0% | 2.0% |
| Doctorate Degree | 2.0% | 2.0% | 2.0% |
Household Income For Pismo Beach, California
5.6% of households in Pismo Beach earn Less than $10,000.
1.4% of households in Pismo Beach earn $10,000 to $14,999.
3.2% of households in Pismo Beach earn $15,000 to $24,999.
4.8% of households in Pismo Beach earn $25,000 to $34,999.
4.7% of households in Pismo Beach earn $35,000 to $49,999.
17.1% of households in Pismo Beach earn $50,000 to $74,999.
7.2% of households in Pismo Beach earn $75,000 to $99,999.
24.3% of households in Pismo Beach earn $100,000 to $149,999.
11.5% of households in Pismo Beach earn $150,000 to $199,999.
20.1% of households in Pismo Beach earn $200,000 or more.
| Income | Pismo Beach | CA | USA |
|---|---|---|---|
| Less than $10,000 | 5.6% | 4.4% | 4.9% |
| $10,000 to $14,999 | 1.4% | 3.2% | 3.8% |
| $15,000 to $24,999 | 3.2% | 5.6% | 7.0% |
| $25,000 to $34,999 | 4.8% | 6.0% | 7.4% |
| $35,000 to $49,999 | 4.7% | 8.7% | 10.7% |
| $50,000 to $74,999 | 17.1% | 13.7% | 16.1% |
| $75,000 to $99,999 | 7.2% | 12.0% | 12.8% |
| $100,000 to $149,999 | 24.3% | 17.8% | 17.1% |
| $150,000 to $199,999 | 11.5% | 10.7% | 8.8% |
| $200,000 or more | 20.1% | 17.9% | 11.4% |


