Pomona, CA
Demographics And Statistics
Living In Pomona, California Summary
Life in Pomona research summary. HomeSnacks has been using Saturday Night Science to research the quality of life in Pomona over the past nine years using Census, FBI, Zillow, and other primary data sources. Based on the most recently available data, we found the following about life in Pomona:
The population in Pomona is 149,831.
The median home value in Pomona is $619,187.
The median income in Pomona is $73,515.
The cost of living in Pomona is 127 which is 1.3x higher than the national average.
The median rent in Pomona is $1,631.
The unemployment rate in Pomona is 6.5%.
The poverty rate in Pomona is 14.8%.
The average high in Pomona is 75.3° and the average low is 54.1°.
Pomona SnackAbility
Overall SnackAbility
Pomona, CA Crime Report
Crime in Pomona summary. We use data from the FBI to determine the crime rates in Pomona. Key points include:
There were 5,253 total crimes in Pomona in the last reporting year.
The overall crime rate per 100,000 people in Pomona is 3,607.8 / 100k people.
The violent crime rate per 100,000 people in Pomona is 590.7 / 100k people.
The property crime rate per 100,000 people in Pomona is 3,017.2 / 100k people.
Overall, crime in Pomona is 55.23% above the national average.
Total Crimes
Above National Average
Crime In Pomona Comparison Table
| Statistic | Count Raw |
Pomona / 100k People |
California / 100k People |
National / 100k People |
|---|---|---|---|---|
| Total Crimes Per 100K | 5,253 | 3,607.8 | 2,581.0 | 2,324.2 |
| Violent Crime | 860 | 590.7 | 442.0 | 369.8 |
| Murder | 14 | 9.6 | 5.6 | 6.3 |
| Robbery | 244 | 167.6 | 113.6 | 66.1 |
| Aggravated Assault | 521 | 357.8 | 288.7 | 268.2 |
| Property Crime | 4,393 | 3,017.2 | 2,138.9 | 1,954.4 |
| Burglary | 774 | 531.6 | 369.7 | 269.8 |
| Larceny | 2,640 | 1,813.2 | 1,341.7 | 1,401.9 |
| Car Theft | 979 | 672.4 | 427.6 | 282.7 |
Pomona, CA Cost Of Living
Cost of living in Pomona summary. We use data on the cost of living to determine how expensive it is to live in Pomona. Real estate prices drive most of the variance in cost of living around California. Key points include:
The cost of living in Pomona is 127 with 100 being average.
The cost of living in Pomona is 1.3x higher than the national average.
The median home value in Pomona is $619,187.
The median income in Pomona is $73,515.
Pomona's Overall Cost Of Living
Higher Than The National Average
Cost Of Living In Pomona Comparison Table
| Living Expense | Pomona | California | National Average | |
|---|---|---|---|---|
| Overall | 127 | 139 | 100 | |
| Services | 117 | 110 | 100 | |
| Groceries | 111 | 112 | 100 | |
| Health | 110 | 109 | 100 | |
| Housing | 154 | 204 | 100 | |
| Transportation | 128 | 126 | 100 | |
| Utilities | 112 | 124 | 100 | |
Pomona, CA Weather
The average high in Pomona is 75.3° and the average low is 54.1°.
There are 22.7 days of precipitation each year.
Expect an average of 16.2 inches of precipitation each year with 0.2 inches of snow.
| Stat | Pomona |
|---|---|
| Average Annual High | 75.3 |
| Average Annual Low | 54.1 |
| Annual Precipitation Days | 22.7 |
| Average Annual Precipitation | 16.2 |
| Average Annual Snowfall | 0.2 |
Average High
Days of Rain
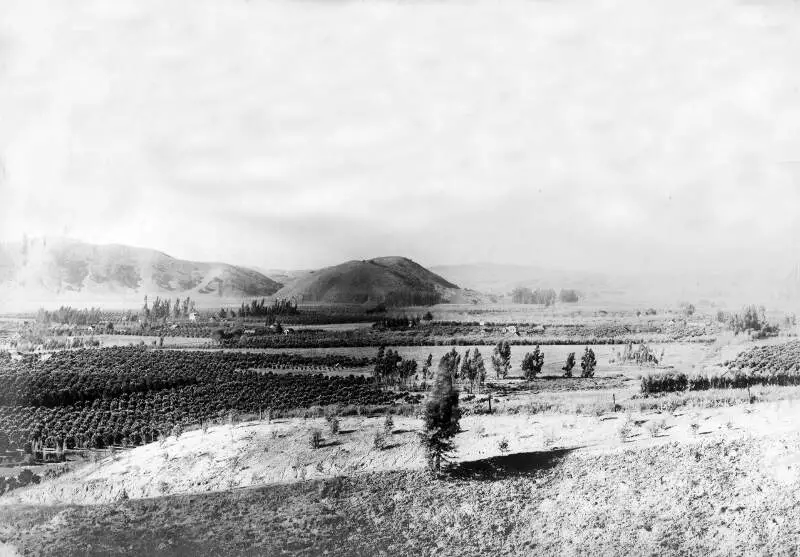
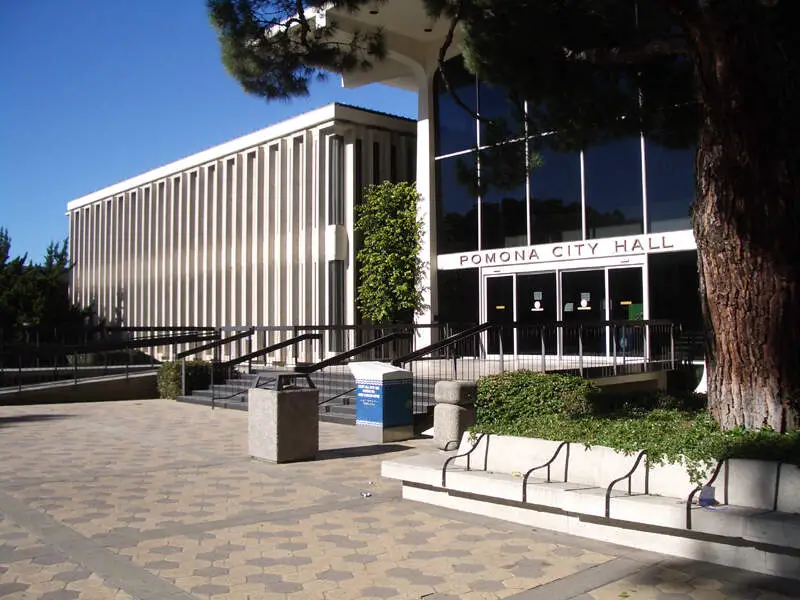
Pomona, CA Photos


1 Reviews & Comments About Pomona
/5

HomeSnacks User - 2018-06-07 17:27:54.177685
City starting to get filled with homeless and crackheads
Rankings for Pomona in California


Locations Around Pomona
Map Of Pomona, CA
Best Places Around Pomona
La Mirada, CA
Population 47,644
Vincent, CA
Population 15,266
Villa Park, CA
Population 5,814
West Puente Valley, CA
Population 22,074
Citrus, CA
Population 10,979
South Monrovia Island, CA
Population 6,833
La Verne, CA
Population 31,239
Yorba Linda, CA
Population 68,035
Placentia, CA
Population 51,797
Orange, CA
Population 138,728
Pomona Demographics And Statistics
Population over time in Pomona
The current population in Pomona is 149,831. The population has increased 0.7% from 2010.
| Year | Population | % Change |
|---|---|---|
| 2022 | 149,831 | -1.7% |
| 2021 | 152,494 | 0.1% |
| 2020 | 152,366 | 0.4% |
| 2019 | 151,807 | 0.0% |
| 2018 | 151,753 | 0.4% |
| 2017 | 151,142 | 0.8% |
| 2016 | 150,006 | 0.4% |
| 2015 | 149,431 | 0.3% |
| 2014 | 148,946 | 0.1% |
| 2013 | 148,775 | - |
Race / Ethnicity in Pomona
Pomona is:
10.1% White with 15,185 White residents.
4.8% African American with 7,127 African American residents.
0.4% American Indian with 572 American Indian residents.
10.5% Asian with 15,670 Asian residents.
0.1% Hawaiian with 137 Hawaiian residents.
0.3% Other with 474 Other residents.
1.8% Two Or More with 2,674 Two Or More residents.
72.1% Hispanic with 107,992 Hispanic residents.
| Race | Pomona | CA | USA |
|---|---|---|---|
| White | 10.1% | 35.2% | 58.9% |
| African American | 4.8% | 5.3% | 12.1% |
| American Indian | 0.4% | 0.3% | 0.6% |
| Asian | 10.5% | 14.9% | 5.7% |
| Hawaiian | 0.1% | 0.3% | 0.2% |
| Other | 0.3% | 0.4% | 0.4% |
| Two Or More | 1.8% | 3.8% | 3.5% |
| Hispanic | 72.1% | 39.7% | 18.7% |
Gender in Pomona
Pomona is 50.7% female with 75,974 female residents.
Pomona is 49.3% male with 73,857 male residents.
| Gender | Pomona | CA | USA |
|---|---|---|---|
| Female | 50.7% | 49.9% | 50.4% |
| Male | 49.3% | 50.1% | 49.6% |
Highest level of educational attainment in Pomona for adults over 25
15.0% of adults in Pomona completed < 9th grade.
12.0% of adults in Pomona completed 9-12th grade.
25.0% of adults in Pomona completed high school / ged.
22.0% of adults in Pomona completed some college.
7.0% of adults in Pomona completed associate's degree.
13.0% of adults in Pomona completed bachelor's degree.
4.0% of adults in Pomona completed master's degree.
1.0% of adults in Pomona completed professional degree.
1.0% of adults in Pomona completed doctorate degree.
| Education | Pomona | CA | USA |
|---|---|---|---|
| < 9th Grade | 15.0% | 9.0% | 4.0% |
| 9-12th Grade | 12.0% | 7.0% | 6.0% |
| High School / GED | 25.0% | 20.0% | 26.0% |
| Some College | 22.0% | 20.0% | 20.0% |
| Associate's Degree | 7.0% | 8.0% | 9.0% |
| Bachelor's Degree | 13.0% | 22.0% | 21.0% |
| Master's Degree | 4.0% | 9.0% | 10.0% |
| Professional Degree | 1.0% | 3.0% | 2.0% |
| Doctorate Degree | 1.0% | 2.0% | 2.0% |
Household Income For Pomona, California
5.4% of households in Pomona earn Less than $10,000.
3.6% of households in Pomona earn $10,000 to $14,999.
6.2% of households in Pomona earn $15,000 to $24,999.
7.2% of households in Pomona earn $25,000 to $34,999.
10.3% of households in Pomona earn $35,000 to $49,999.
18.2% of households in Pomona earn $50,000 to $74,999.
14.6% of households in Pomona earn $75,000 to $99,999.
18.4% of households in Pomona earn $100,000 to $149,999.
8.9% of households in Pomona earn $150,000 to $199,999.
7.2% of households in Pomona earn $200,000 or more.
| Income | Pomona | CA | USA |
|---|---|---|---|
| Less than $10,000 | 5.4% | 4.4% | 4.9% |
| $10,000 to $14,999 | 3.6% | 3.2% | 3.8% |
| $15,000 to $24,999 | 6.2% | 5.6% | 7.0% |
| $25,000 to $34,999 | 7.2% | 6.0% | 7.4% |
| $35,000 to $49,999 | 10.3% | 8.7% | 10.7% |
| $50,000 to $74,999 | 18.2% | 13.7% | 16.1% |
| $75,000 to $99,999 | 14.6% | 12.0% | 12.8% |
| $100,000 to $149,999 | 18.4% | 17.8% | 17.1% |
| $150,000 to $199,999 | 8.9% | 10.7% | 8.8% |
| $200,000 or more | 7.2% | 17.9% | 11.4% |


