Richmond, CA
Demographics And Statistics
Living In Richmond, California Summary
Life in Richmond research summary. HomeSnacks has been using Saturday Night Science to research the quality of life in Richmond over the past nine years using Census, FBI, Zillow, and other primary data sources. Based on the most recently available data, we found the following about life in Richmond:
The population in Richmond is 115,619.
The median home value in Richmond is $633,759.
The median income in Richmond is $86,618.
The cost of living in Richmond is 137 which is 1.4x higher than the national average.
The median rent in Richmond is $1,853.
The unemployment rate in Richmond is 6.9%.
The poverty rate in Richmond is 14.3%.
The average high in Richmond is 70.4° and the average low is 48.6°.
Richmond SnackAbility
Overall SnackAbility
Richmond, CA Crime Report
Crime in Richmond summary. We use data from the FBI to determine the crime rates in Richmond. Key points include:
There were 4,122 total crimes in Richmond in the last reporting year.
The overall crime rate per 100,000 people in Richmond is 3,583.0 / 100k people.
The violent crime rate per 100,000 people in Richmond is 873.6 / 100k people.
The property crime rate per 100,000 people in Richmond is 2,709.4 / 100k people.
Overall, crime in Richmond is 54.16% above the national average.
Total Crimes
Above National Average
Crime In Richmond Comparison Table
| Statistic | Count Raw |
Richmond / 100k People |
California / 100k People |
National / 100k People |
|---|---|---|---|---|
| Total Crimes Per 100K | 4,122 | 3,583.0 | 2,581.0 | 2,324.2 |
| Violent Crime | 1,005 | 873.6 | 442.0 | 369.8 |
| Murder | 17 | 14.8 | 5.6 | 6.3 |
| Robbery | 240 | 208.6 | 113.6 | 66.1 |
| Aggravated Assault | 724 | 629.3 | 288.7 | 268.2 |
| Property Crime | 3,117 | 2,709.4 | 2,138.9 | 1,954.4 |
| Burglary | 252 | 219.0 | 369.7 | 269.8 |
| Larceny | 1,830 | 1,590.7 | 1,341.7 | 1,401.9 |
| Car Theft | 1,035 | 899.7 | 427.6 | 282.7 |
Richmond, CA Cost Of Living
Cost of living in Richmond summary. We use data on the cost of living to determine how expensive it is to live in Richmond. Real estate prices drive most of the variance in cost of living around California. Key points include:
The cost of living in Richmond is 137 with 100 being average.
The cost of living in Richmond is 1.4x higher than the national average.
The median home value in Richmond is $633,759.
The median income in Richmond is $86,618.
Richmond's Overall Cost Of Living
Higher Than The National Average
Cost Of Living In Richmond Comparison Table
| Living Expense | Richmond | California | National Average | |
|---|---|---|---|---|
| Overall | 137 | 139 | 100 | |
| Services | 120 | 110 | 100 | |
| Groceries | 131 | 112 | 100 | |
| Health | 130 | 109 | 100 | |
| Housing | 163 | 204 | 100 | |
| Transportation | 132 | 126 | 100 | |
| Utilities | 128 | 124 | 100 | |
Richmond, CA Weather
The average high in Richmond is 70.4° and the average low is 48.6°.
There are 41.7 days of precipitation each year.
Expect an average of 21.0 inches of precipitation each year with 0.2 inches of snow.
| Stat | Richmond |
|---|---|
| Average Annual High | 70.4 |
| Average Annual Low | 48.6 |
| Annual Precipitation Days | 41.7 |
| Average Annual Precipitation | 21.0 |
| Average Annual Snowfall | 0.2 |
Average High
Days of Rain
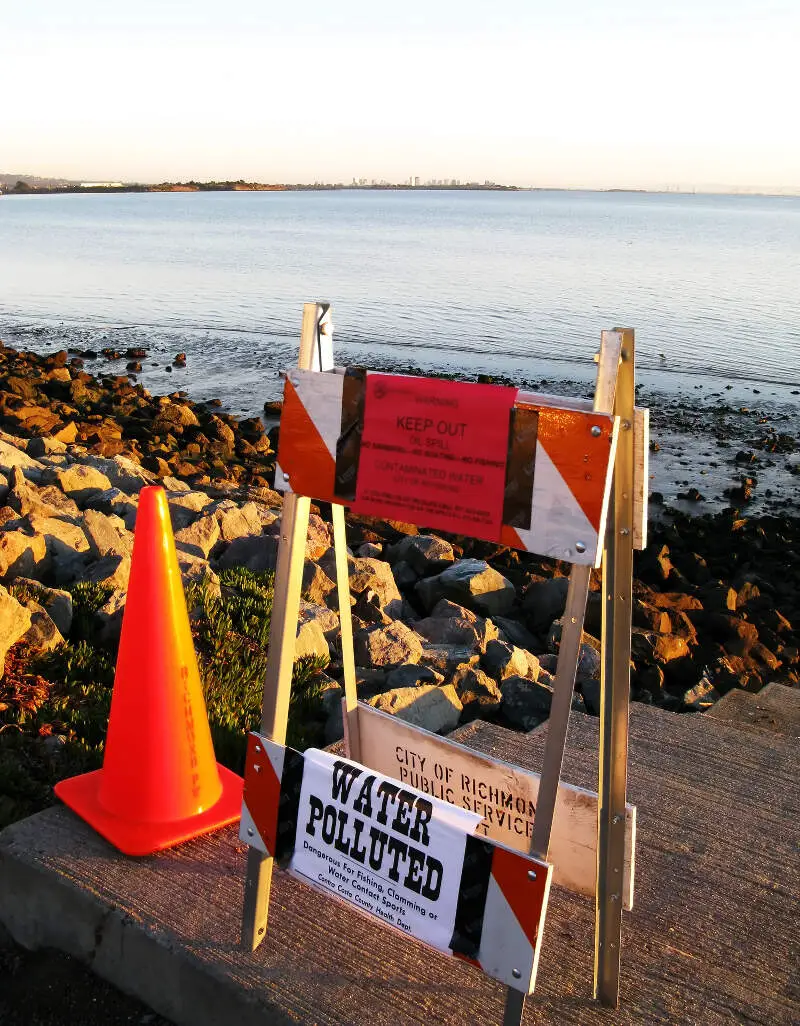
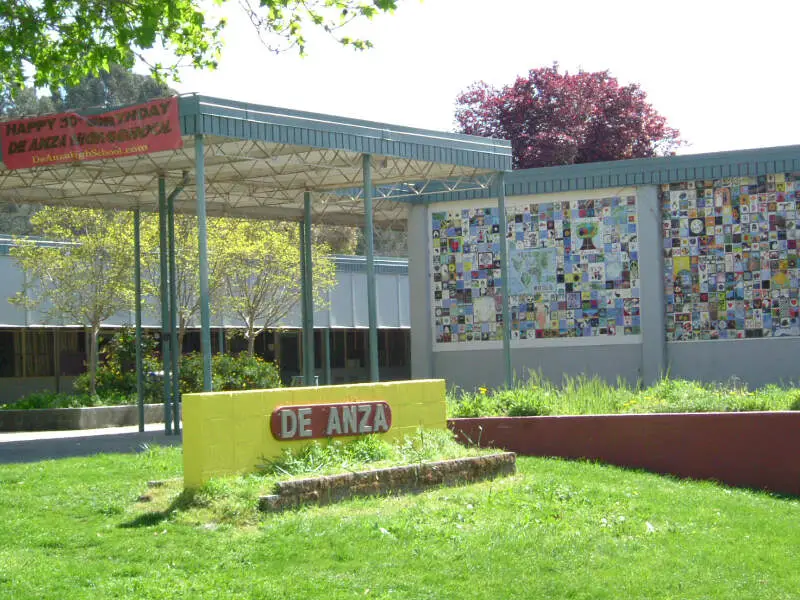
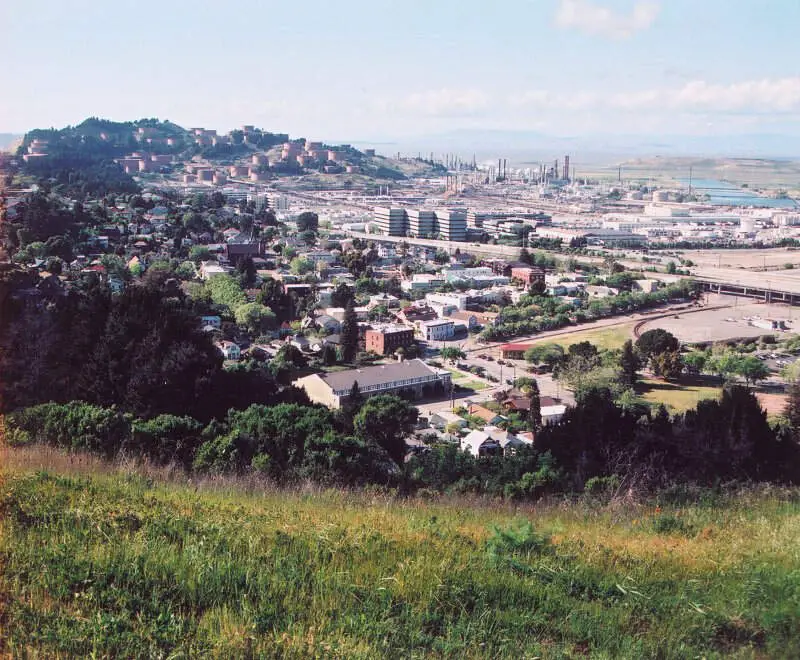
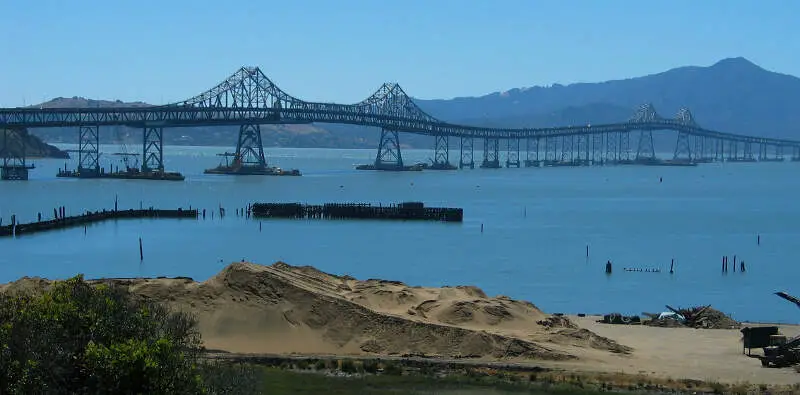
Richmond, CA Photos


1 Reviews & Comments About Richmond
/5

Billy Goat7 -
I live in Richmond and Richmond is very safe. It is very beautiful. You stupid morons just look at a map and think, ' OW, this city looks poor. Well it it's in the 10.' NO! It is such a good city and its beautiful. Shut your mouth and maybe you should go get research from people that live here. NOT PEOPLE THAT JUST ASSUME. DUMB A*S!! The schools are pretty good, too! One of the best charter schools in the world is here in richmond! So stop assuming and get you d**n facts straight!
Richmond Articles

Rankings for Richmond in California


Locations Around Richmond
Map Of Richmond, CA
Best Places Around Richmond
Piedmont, CA
Population 11,161
Kensington, CA
Population 5,309
Lucas Valley-Marinwood, CA
Population 6,334
Fairfax, CA
Population 7,567
Mountain View, CA
Population 82,132
Kentfield, CA
Population 7,410
Lafayette, CA
Population 25,310
Hercules, CA
Population 26,041
Orinda, CA
Population 19,477
American Canyon, CA
Population 21,669
Richmond Demographics And Statistics
Population over time in Richmond
The current population in Richmond is 115,619. The population has increased 13.1% from 2010.
| Year | Population | % Change |
|---|---|---|
| 2022 | 115,619 | 5.7% |
| 2021 | 109,340 | 0.4% |
| 2020 | 108,853 | 0.5% |
| 2019 | 108,303 | 0.7% |
| 2018 | 107,597 | 1.1% |
| 2017 | 106,469 | 1.1% |
| 2016 | 105,280 | 1.0% |
| 2015 | 104,225 | 1.0% |
| 2014 | 103,161 | 0.9% |
| 2013 | 102,264 | - |
Race / Ethnicity in Richmond
Richmond is:
17.5% White with 20,223 White residents.
17.8% African American with 20,540 African American residents.
0.2% American Indian with 267 American Indian residents.
14.0% Asian with 16,152 Asian residents.
0.5% Hawaiian with 528 Hawaiian residents.
1.1% Other with 1,260 Other residents.
5.0% Two Or More with 5,763 Two Or More residents.
44.0% Hispanic with 50,886 Hispanic residents.
| Race | Richmond | CA | USA |
|---|---|---|---|
| White | 17.5% | 35.2% | 58.9% |
| African American | 17.8% | 5.3% | 12.1% |
| American Indian | 0.2% | 0.3% | 0.6% |
| Asian | 14.0% | 14.9% | 5.7% |
| Hawaiian | 0.5% | 0.3% | 0.2% |
| Other | 1.1% | 0.4% | 0.4% |
| Two Or More | 5.0% | 3.8% | 3.5% |
| Hispanic | 44.0% | 39.7% | 18.7% |
Gender in Richmond
Richmond is 50.6% female with 58,487 female residents.
Richmond is 49.4% male with 57,131 male residents.
| Gender | Richmond | CA | USA |
|---|---|---|---|
| Female | 50.6% | 49.9% | 50.4% |
| Male | 49.4% | 50.1% | 49.6% |
Highest level of educational attainment in Richmond for adults over 25
12.0% of adults in Richmond completed < 9th grade.
8.0% of adults in Richmond completed 9-12th grade.
20.0% of adults in Richmond completed high school / ged.
20.0% of adults in Richmond completed some college.
7.0% of adults in Richmond completed associate's degree.
20.0% of adults in Richmond completed bachelor's degree.
9.0% of adults in Richmond completed master's degree.
2.0% of adults in Richmond completed professional degree.
2.0% of adults in Richmond completed doctorate degree.
| Education | Richmond | CA | USA |
|---|---|---|---|
| < 9th Grade | 12.0% | 9.0% | 4.0% |
| 9-12th Grade | 8.0% | 7.0% | 6.0% |
| High School / GED | 20.0% | 20.0% | 26.0% |
| Some College | 20.0% | 20.0% | 20.0% |
| Associate's Degree | 7.0% | 8.0% | 9.0% |
| Bachelor's Degree | 20.0% | 22.0% | 21.0% |
| Master's Degree | 9.0% | 9.0% | 10.0% |
| Professional Degree | 2.0% | 3.0% | 2.0% |
| Doctorate Degree | 2.0% | 2.0% | 2.0% |
Household Income For Richmond, California
4.6% of households in Richmond earn Less than $10,000.
4.5% of households in Richmond earn $10,000 to $14,999.
5.2% of households in Richmond earn $15,000 to $24,999.
5.5% of households in Richmond earn $25,000 to $34,999.
9.8% of households in Richmond earn $35,000 to $49,999.
13.7% of households in Richmond earn $50,000 to $74,999.
13.6% of households in Richmond earn $75,000 to $99,999.
19.5% of households in Richmond earn $100,000 to $149,999.
11.2% of households in Richmond earn $150,000 to $199,999.
12.3% of households in Richmond earn $200,000 or more.
| Income | Richmond | CA | USA |
|---|---|---|---|
| Less than $10,000 | 4.6% | 4.4% | 4.9% |
| $10,000 to $14,999 | 4.5% | 3.2% | 3.8% |
| $15,000 to $24,999 | 5.2% | 5.6% | 7.0% |
| $25,000 to $34,999 | 5.5% | 6.0% | 7.4% |
| $35,000 to $49,999 | 9.8% | 8.7% | 10.7% |
| $50,000 to $74,999 | 13.7% | 13.7% | 16.1% |
| $75,000 to $99,999 | 13.6% | 12.0% | 12.8% |
| $100,000 to $149,999 | 19.5% | 17.8% | 17.1% |
| $150,000 to $199,999 | 11.2% | 10.7% | 8.8% |
| $200,000 or more | 12.3% | 17.9% | 11.4% |


