San Luis Obispo, CA
Demographics And Statistics
Living In San Luis Obispo, California Summary
Life in San Luis Obispo research summary. HomeSnacks has been using Saturday Night Science to research the quality of life in San Luis Obispo over the past nine years using Census, FBI, Zillow, and other primary data sources. Based on the most recently available data, we found the following about life in San Luis Obispo:
The population in San Luis Obispo is 47,529.
The median home value in San Luis Obispo is $1,026,106.
The median income in San Luis Obispo is $65,000.
The cost of living in San Luis Obispo is 155 which is 1.6x higher than the national average.
The median rent in San Luis Obispo is $1,850.
The unemployment rate in San Luis Obispo is 6.9%.
The poverty rate in San Luis Obispo is 31.5%.
The average high in San Luis Obispo is 70.3° and the average low is 46.2°.
San Luis Obispo SnackAbility
Overall SnackAbility
San Luis Obispo, CA Crime Report
Crime in San Luis Obispo summary. We use data from the FBI to determine the crime rates in San Luis Obispo. Key points include:
There were 2,012 total crimes in San Luis Obispo in the last reporting year.
The overall crime rate per 100,000 people in San Luis Obispo is 4,192.5 / 100k people.
The violent crime rate per 100,000 people in San Luis Obispo is 556.4 / 100k people.
The property crime rate per 100,000 people in San Luis Obispo is 3,636.2 / 100k people.
Overall, crime in San Luis Obispo is 80.39% above the national average.
Total Crimes
Above National Average
Crime In San Luis Obispo Comparison Table
| Statistic | Count Raw |
San Luis Obispo / 100k People |
California / 100k People |
National / 100k People |
|---|---|---|---|---|
| Total Crimes Per 100K | 2,012 | 4,192.5 | 2,581.0 | 2,324.2 |
| Violent Crime | 267 | 556.4 | 442.0 | 369.8 |
| Murder | 0 | 0.0 | 5.6 | 6.3 |
| Robbery | 40 | 83.4 | 113.6 | 66.1 |
| Aggravated Assault | 189 | 393.8 | 288.7 | 268.2 |
| Property Crime | 1,745 | 3,636.2 | 2,138.9 | 1,954.4 |
| Burglary | 254 | 529.3 | 369.7 | 269.8 |
| Larceny | 1,372 | 2,858.9 | 1,341.7 | 1,401.9 |
| Car Theft | 119 | 248.0 | 427.6 | 282.7 |
San Luis Obispo, CA Cost Of Living
Cost of living in San Luis Obispo summary. We use data on the cost of living to determine how expensive it is to live in San Luis Obispo. Real estate prices drive most of the variance in cost of living around California. Key points include:
The cost of living in San Luis Obispo is 155 with 100 being average.
The cost of living in San Luis Obispo is 1.6x higher than the national average.
The median home value in San Luis Obispo is $1,026,106.
The median income in San Luis Obispo is $65,000.
San Luis Obispo's Overall Cost Of Living
Higher Than The National Average
Cost Of Living In San Luis Obispo Comparison Table
| Living Expense | San Luis Obispo | California | National Average | |
|---|---|---|---|---|
| Overall | 155 | 139 | 100 | |
| Services | 103 | 110 | 100 | |
| Groceries | 111 | 112 | 100 | |
| Health | 100 | 109 | 100 | |
| Housing | 257 | 204 | 100 | |
| Transportation | 117 | 126 | 100 | |
| Utilities | 159 | 124 | 100 | |
San Luis Obispo, CA Weather
The average high in San Luis Obispo is 70.3° and the average low is 46.2°.
There are 31.0 days of precipitation each year.
Expect an average of 18.2 inches of precipitation each year with 0.0 inches of snow.
| Stat | San Luis Obispo |
|---|---|
| Average Annual High | 70.3 |
| Average Annual Low | 46.2 |
| Annual Precipitation Days | 31.0 |
| Average Annual Precipitation | 18.2 |
| Average Annual Snowfall | 0.0 |
Average High
Days of Rain
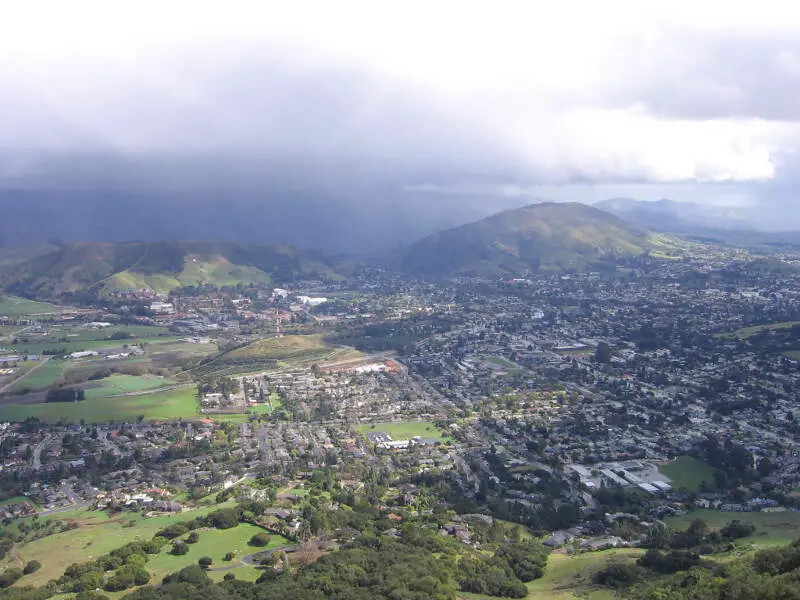
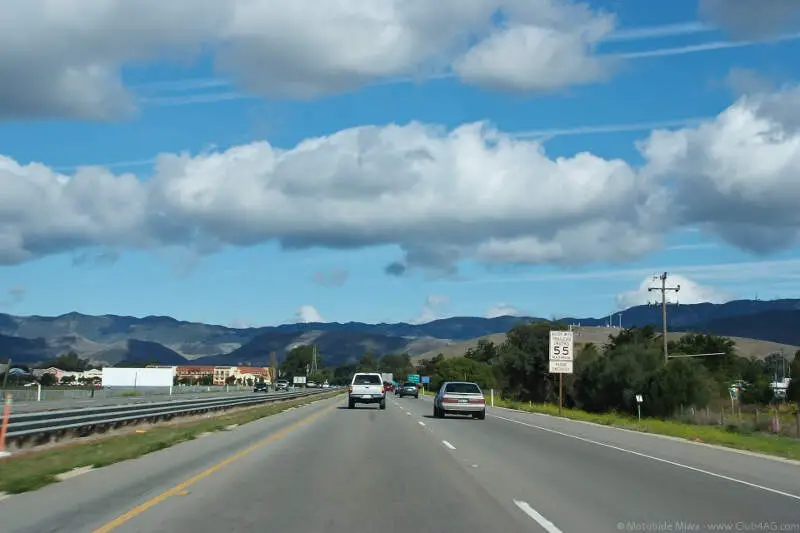
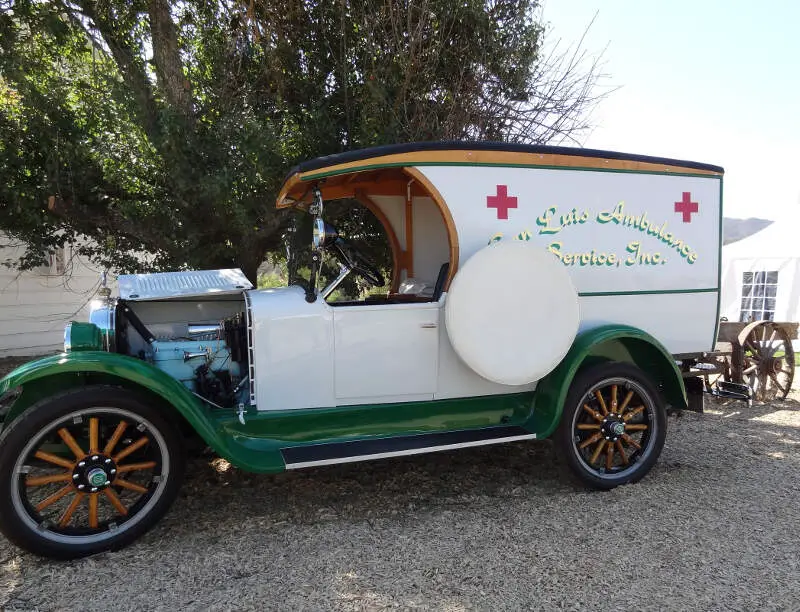
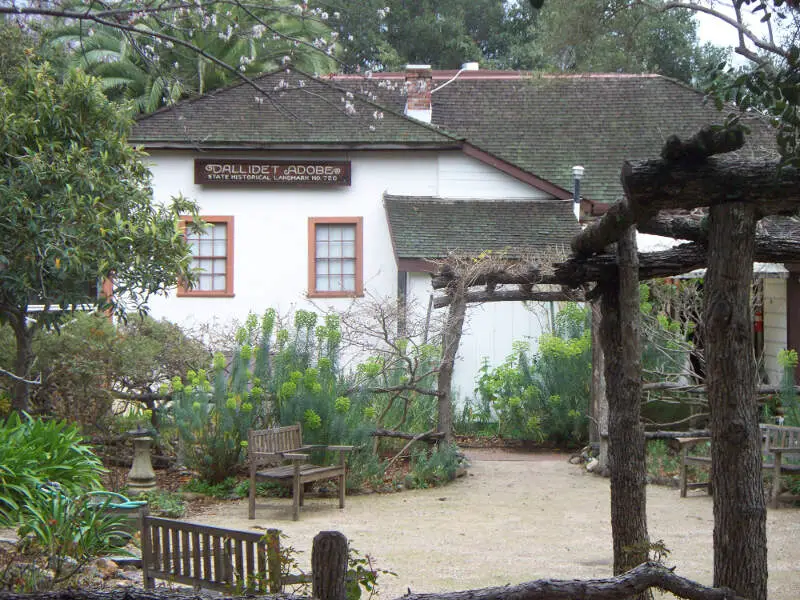
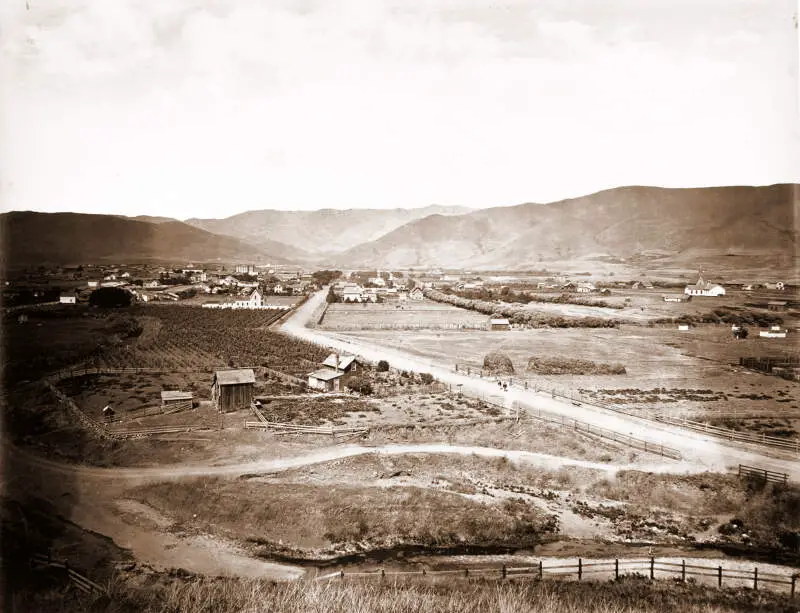
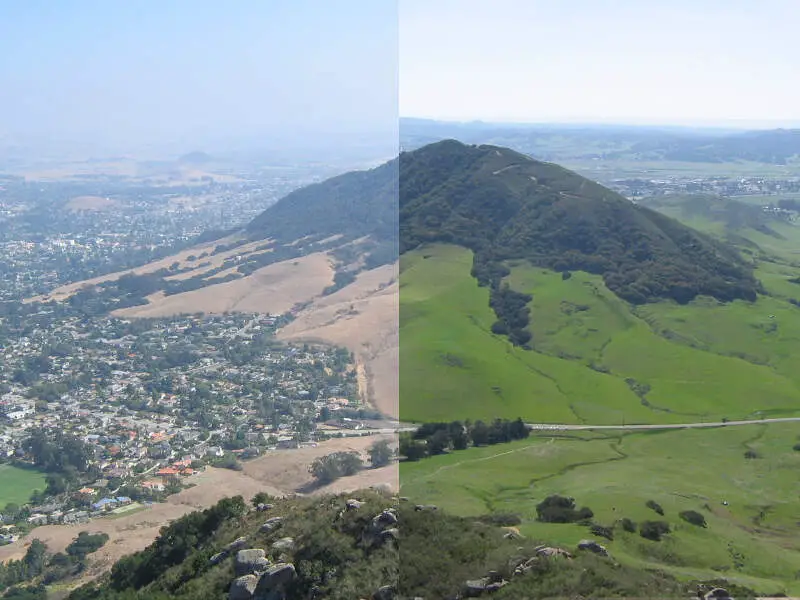
San Luis Obispo, CA Photos


Rankings for San Luis Obispo in California


Locations Around San Luis Obispo
Map Of San Luis Obispo, CA
Best Places Around San Luis Obispo
Nipomo, CA
Population 18,009
Grover Beach, CA
Population 12,757
Los Osos, CA
Population 15,523
Atascadero, CA
Population 29,758
Arroyo Grande, CA
Population 18,435
Oceano, CA
Population 7,287
Morro Bay, CA
Population 10,766
Pismo Beach, CA
Population 8,050
San Luis Obispo Demographics And Statistics
Population over time in San Luis Obispo
The current population in San Luis Obispo is 47,529. The population has increased 5.7% from 2010.
| Year | Population | % Change |
|---|---|---|
| 2022 | 47,529 | 0.8% |
| 2021 | 47,160 | 0.3% |
| 2020 | 46,997 | 0.6% |
| 2019 | 46,716 | 0.8% |
| 2018 | 46,337 | 0.9% |
| 2017 | 45,911 | 0.7% |
| 2016 | 45,584 | 0.6% |
| 2015 | 45,328 | 0.4% |
| 2014 | 45,130 | 0.4% |
| 2013 | 44,959 | - |
Race / Ethnicity in San Luis Obispo
San Luis Obispo is:
70.4% White with 33,463 White residents.
1.3% African American with 620 African American residents.
0.2% American Indian with 79 American Indian residents.
5.1% Asian with 2,447 Asian residents.
0.1% Hawaiian with 29 Hawaiian residents.
0.3% Other with 161 Other residents.
4.6% Two Or More with 2,209 Two Or More residents.
17.9% Hispanic with 8,521 Hispanic residents.
| Race | San Luis Obispo | CA | USA |
|---|---|---|---|
| White | 70.4% | 35.2% | 58.9% |
| African American | 1.3% | 5.3% | 12.1% |
| American Indian | 0.2% | 0.3% | 0.6% |
| Asian | 5.1% | 14.9% | 5.7% |
| Hawaiian | 0.1% | 0.3% | 0.2% |
| Other | 0.3% | 0.4% | 0.4% |
| Two Or More | 4.6% | 3.8% | 3.5% |
| Hispanic | 17.9% | 39.7% | 18.7% |
Gender in San Luis Obispo
San Luis Obispo is 49.3% female with 23,430 female residents.
San Luis Obispo is 50.7% male with 24,098 male residents.
| Gender | San Luis Obispo | CA | USA |
|---|---|---|---|
| Female | 49.3% | 49.9% | 50.4% |
| Male | 50.7% | 50.1% | 49.6% |
Highest level of educational attainment in San Luis Obispo for adults over 25
2.0% of adults in San Luis Obispo completed < 9th grade.
2.0% of adults in San Luis Obispo completed 9-12th grade.
13.0% of adults in San Luis Obispo completed high school / ged.
22.0% of adults in San Luis Obispo completed some college.
8.0% of adults in San Luis Obispo completed associate's degree.
31.0% of adults in San Luis Obispo completed bachelor's degree.
14.0% of adults in San Luis Obispo completed master's degree.
4.0% of adults in San Luis Obispo completed professional degree.
4.0% of adults in San Luis Obispo completed doctorate degree.
| Education | San Luis Obispo | CA | USA |
|---|---|---|---|
| < 9th Grade | 2.0% | 9.0% | 4.0% |
| 9-12th Grade | 2.0% | 7.0% | 6.0% |
| High School / GED | 13.0% | 20.0% | 26.0% |
| Some College | 22.0% | 20.0% | 20.0% |
| Associate's Degree | 8.0% | 8.0% | 9.0% |
| Bachelor's Degree | 31.0% | 22.0% | 21.0% |
| Master's Degree | 14.0% | 9.0% | 10.0% |
| Professional Degree | 4.0% | 3.0% | 2.0% |
| Doctorate Degree | 4.0% | 2.0% | 2.0% |
Household Income For San Luis Obispo, California
8.7% of households in San Luis Obispo earn Less than $10,000.
5.5% of households in San Luis Obispo earn $10,000 to $14,999.
8.9% of households in San Luis Obispo earn $15,000 to $24,999.
8.0% of households in San Luis Obispo earn $25,000 to $34,999.
10.3% of households in San Luis Obispo earn $35,000 to $49,999.
13.3% of households in San Luis Obispo earn $50,000 to $74,999.
8.7% of households in San Luis Obispo earn $75,000 to $99,999.
15.5% of households in San Luis Obispo earn $100,000 to $149,999.
7.1% of households in San Luis Obispo earn $150,000 to $199,999.
13.9% of households in San Luis Obispo earn $200,000 or more.
| Income | San Luis Obispo | CA | USA |
|---|---|---|---|
| Less than $10,000 | 8.7% | 4.4% | 4.9% |
| $10,000 to $14,999 | 5.5% | 3.2% | 3.8% |
| $15,000 to $24,999 | 8.9% | 5.6% | 7.0% |
| $25,000 to $34,999 | 8.0% | 6.0% | 7.4% |
| $35,000 to $49,999 | 10.3% | 8.7% | 10.7% |
| $50,000 to $74,999 | 13.3% | 13.7% | 16.1% |
| $75,000 to $99,999 | 8.7% | 12.0% | 12.8% |
| $100,000 to $149,999 | 15.5% | 17.8% | 17.1% |
| $150,000 to $199,999 | 7.1% | 10.7% | 8.8% |
| $200,000 or more | 13.9% | 17.9% | 11.4% |


