Turlock, CA
Demographics And Statistics
Living In Turlock, California Summary
Life in Turlock research summary. HomeSnacks has been using Saturday Night Science to research the quality of life in Turlock over the past nine years using Census, FBI, Zillow, and other primary data sources. Based on the most recently available data, we found the following about life in Turlock:
The population in Turlock is 72,504.
The median home value in Turlock is $464,841.
The median income in Turlock is $74,559.
The cost of living in Turlock is 112 which is 1.1x higher than the national average.
The median rent in Turlock is $1,389.
The unemployment rate in Turlock is 7.6%.
The poverty rate in Turlock is 13.1%.
The average high in Turlock is 75.0° and the average low is 49.0°.
Turlock SnackAbility
Overall SnackAbility
Turlock, CA Crime Report
Crime in Turlock summary. We use data from the FBI to determine the crime rates in Turlock. Key points include:
There were 2,505 total crimes in Turlock in the last reporting year.
The overall crime rate per 100,000 people in Turlock is 3,443.2 / 100k people.
The violent crime rate per 100,000 people in Turlock is 574.5 / 100k people.
The property crime rate per 100,000 people in Turlock is 2,868.6 / 100k people.
Overall, crime in Turlock is 48.14% above the national average.
Total Crimes
Above National Average
Crime In Turlock Comparison Table
| Statistic | Count Raw |
Turlock / 100k People |
California / 100k People |
National / 100k People |
|---|---|---|---|---|
| Total Crimes Per 100K | 2,505 | 3,443.2 | 2,581.0 | 2,324.2 |
| Violent Crime | 418 | 574.5 | 442.0 | 369.8 |
| Murder | 4 | 5.5 | 5.6 | 6.3 |
| Robbery | 106 | 145.7 | 113.6 | 66.1 |
| Aggravated Assault | 268 | 368.4 | 288.7 | 268.2 |
| Property Crime | 2,087 | 2,868.6 | 2,138.9 | 1,954.4 |
| Burglary | 278 | 382.1 | 369.7 | 269.8 |
| Larceny | 1,560 | 2,144.2 | 1,341.7 | 1,401.9 |
| Car Theft | 249 | 342.3 | 427.6 | 282.7 |
Turlock, CA Cost Of Living
Cost of living in Turlock summary. We use data on the cost of living to determine how expensive it is to live in Turlock. Real estate prices drive most of the variance in cost of living around California. Key points include:
The cost of living in Turlock is 112 with 100 being average.
The cost of living in Turlock is 1.1x higher than the national average.
The median home value in Turlock is $464,841.
The median income in Turlock is $74,559.
Turlock's Overall Cost Of Living
Higher Than The National Average
Cost Of Living In Turlock Comparison Table
| Living Expense | Turlock | California | National Average | |
|---|---|---|---|---|
| Overall | 112 | 139 | 100 | |
| Services | 100 | 110 | 100 | |
| Groceries | 105 | 112 | 100 | |
| Health | 96 | 109 | 100 | |
| Housing | 120 | 204 | 100 | |
| Transportation | 125 | 126 | 100 | |
| Utilities | 141 | 124 | 100 | |
Turlock, CA Weather
The average high in Turlock is 75.0° and the average low is 49.0°.
There are 35.6 days of precipitation each year.
Expect an average of 13.3 inches of precipitation each year with 0.1 inches of snow.
| Stat | Turlock |
|---|---|
| Average Annual High | 75.0 |
| Average Annual Low | 49.0 |
| Annual Precipitation Days | 35.6 |
| Average Annual Precipitation | 13.3 |
| Average Annual Snowfall | 0.1 |
Average High
Days of Rain
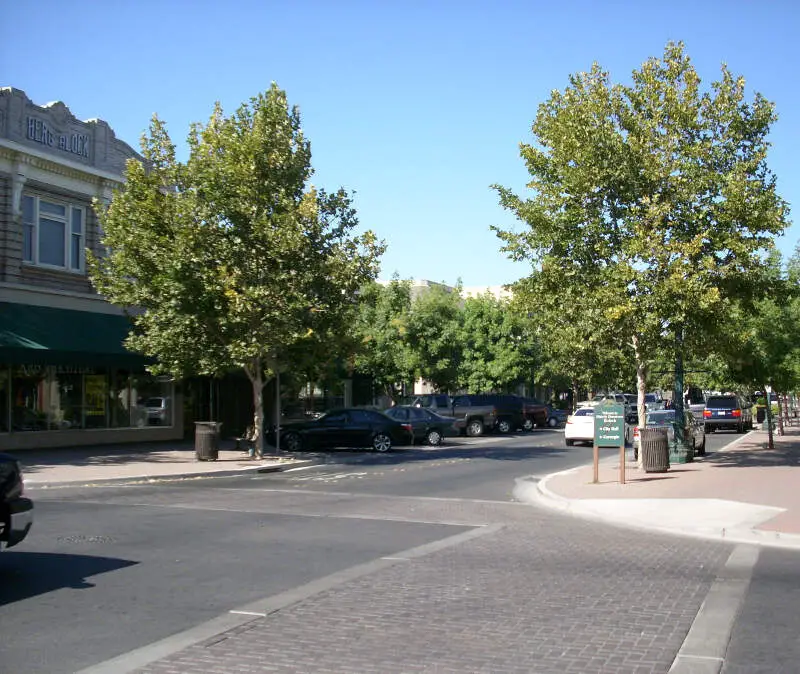
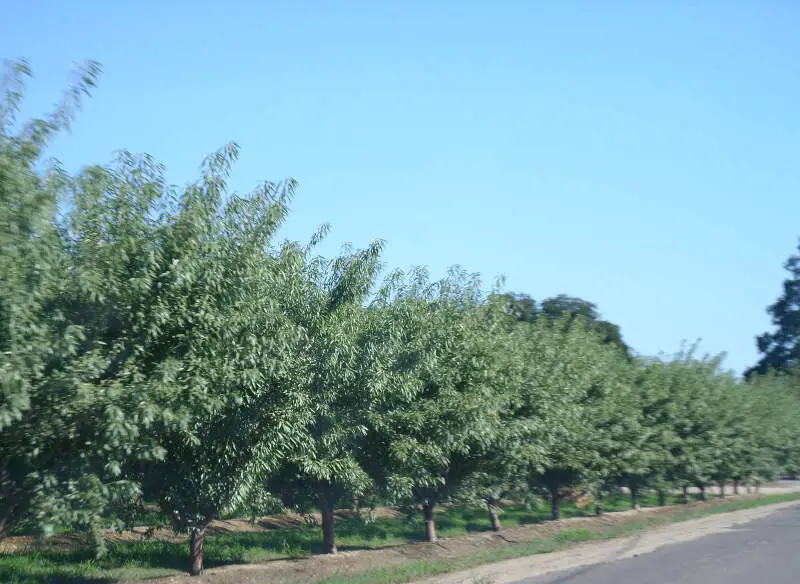
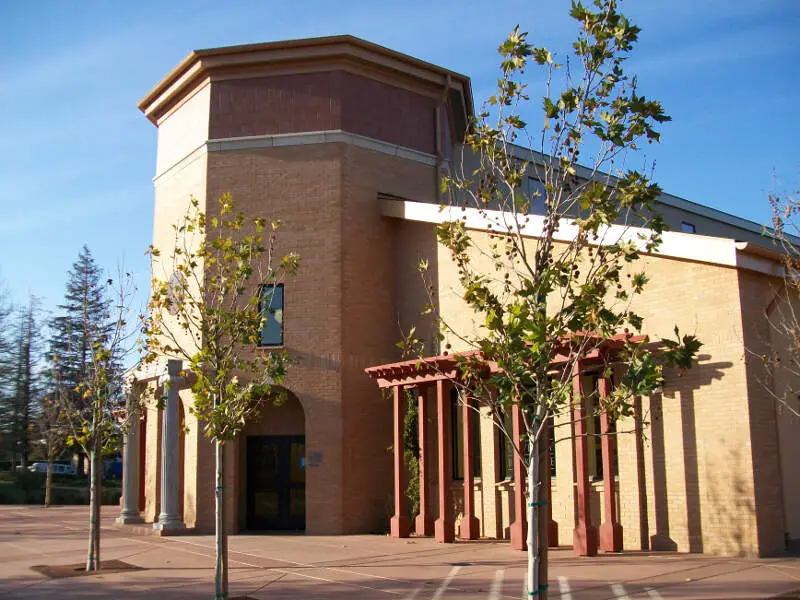
Turlock, CA Photos

Rankings for Turlock in California


Locations Around Turlock
Map Of Turlock, CA
Best Places Around Turlock
Hughson, CA
Population 7,523
Riverbank, CA
Population 24,803
Salida, CA
Population 14,849
Waterford, CA
Population 9,165
Keyes, CA
Population 5,827
Delhi, CA
Population 10,896
Oakdale, CA
Population 23,120
Modesto, CA
Population 218,308
Ceres, CA
Population 49,183
Livingston, CA
Population 14,344
Turlock Demographics And Statistics
Population over time in Turlock
The current population in Turlock is 72,504. The population has increased 7.6% from 2010.
| Year | Population | % Change |
|---|---|---|
| 2022 | 72,504 | 0.2% |
| 2021 | 72,335 | 0.6% |
| 2020 | 71,906 | 1.0% |
| 2019 | 71,166 | 0.8% |
| 2018 | 70,596 | 1.0% |
| 2017 | 69,875 | 1.0% |
| 2016 | 69,185 | 0.9% |
| 2015 | 68,576 | 0.9% |
| 2014 | 67,953 | 0.9% |
| 2013 | 67,376 | - |
Race / Ethnicity in Turlock
Turlock is:
41.9% White with 30,409 White residents.
2.2% African American with 1,612 African American residents.
0.1% American Indian with 70 American Indian residents.
6.0% Asian with 4,322 Asian residents.
0.4% Hawaiian with 278 Hawaiian residents.
0.6% Other with 399 Other residents.
4.4% Two Or More with 3,219 Two Or More residents.
44.4% Hispanic with 32,195 Hispanic residents.
| Race | Turlock | CA | USA |
|---|---|---|---|
| White | 41.9% | 35.2% | 58.9% |
| African American | 2.2% | 5.3% | 12.1% |
| American Indian | 0.1% | 0.3% | 0.6% |
| Asian | 6.0% | 14.9% | 5.7% |
| Hawaiian | 0.4% | 0.3% | 0.2% |
| Other | 0.6% | 0.4% | 0.4% |
| Two Or More | 4.4% | 3.8% | 3.5% |
| Hispanic | 44.4% | 39.7% | 18.7% |
Gender in Turlock
Turlock is 52.0% female with 37,669 female residents.
Turlock is 48.0% male with 34,835 male residents.
| Gender | Turlock | CA | USA |
|---|---|---|---|
| Female | 52.0% | 49.9% | 50.4% |
| Male | 48.0% | 50.1% | 49.6% |
Highest level of educational attainment in Turlock for adults over 25
12.0% of adults in Turlock completed < 9th grade.
8.0% of adults in Turlock completed 9-12th grade.
23.0% of adults in Turlock completed high school / ged.
23.0% of adults in Turlock completed some college.
9.0% of adults in Turlock completed associate's degree.
17.0% of adults in Turlock completed bachelor's degree.
6.0% of adults in Turlock completed master's degree.
1.0% of adults in Turlock completed professional degree.
1.0% of adults in Turlock completed doctorate degree.
| Education | Turlock | CA | USA |
|---|---|---|---|
| < 9th Grade | 12.0% | 9.0% | 4.0% |
| 9-12th Grade | 8.0% | 7.0% | 6.0% |
| High School / GED | 23.0% | 20.0% | 26.0% |
| Some College | 23.0% | 20.0% | 20.0% |
| Associate's Degree | 9.0% | 8.0% | 9.0% |
| Bachelor's Degree | 17.0% | 22.0% | 21.0% |
| Master's Degree | 6.0% | 9.0% | 10.0% |
| Professional Degree | 1.0% | 3.0% | 2.0% |
| Doctorate Degree | 1.0% | 2.0% | 2.0% |
Household Income For Turlock, California
4.2% of households in Turlock earn Less than $10,000.
2.9% of households in Turlock earn $10,000 to $14,999.
8.1% of households in Turlock earn $15,000 to $24,999.
8.9% of households in Turlock earn $25,000 to $34,999.
10.4% of households in Turlock earn $35,000 to $49,999.
15.8% of households in Turlock earn $50,000 to $74,999.
13.1% of households in Turlock earn $75,000 to $99,999.
18.7% of households in Turlock earn $100,000 to $149,999.
8.5% of households in Turlock earn $150,000 to $199,999.
9.5% of households in Turlock earn $200,000 or more.
| Income | Turlock | CA | USA |
|---|---|---|---|
| Less than $10,000 | 4.2% | 4.4% | 4.9% |
| $10,000 to $14,999 | 2.9% | 3.2% | 3.8% |
| $15,000 to $24,999 | 8.1% | 5.6% | 7.0% |
| $25,000 to $34,999 | 8.9% | 6.0% | 7.4% |
| $35,000 to $49,999 | 10.4% | 8.7% | 10.7% |
| $50,000 to $74,999 | 15.8% | 13.7% | 16.1% |
| $75,000 to $99,999 | 13.1% | 12.0% | 12.8% |
| $100,000 to $149,999 | 18.7% | 17.8% | 17.1% |
| $150,000 to $199,999 | 8.5% | 10.7% | 8.8% |
| $200,000 or more | 9.5% | 17.9% | 11.4% |


