Vallejo, CA
Demographics And Statistics
Living In Vallejo, California Summary
Life in Vallejo research summary. HomeSnacks has been using Saturday Night Science to research the quality of life in Vallejo over the past nine years using Census, FBI, Zillow, and other primary data sources. Based on the most recently available data, we found the following about life in Vallejo:
The population in Vallejo is 125,132.
The median home value in Vallejo is $537,019.
The median income in Vallejo is $86,112.
The cost of living in Vallejo is 129 which is 1.3x higher than the national average.
The median rent in Vallejo is $1,894.
The unemployment rate in Vallejo is 7.0%.
The poverty rate in Vallejo is 11.5%.
The average high in Vallejo is 72.1° and the average low is 47.9°.
Vallejo SnackAbility
Overall SnackAbility
Vallejo, CA Crime Report
Crime in Vallejo summary. We use data from the FBI to determine the crime rates in Vallejo. Key points include:
There were 6,452 total crimes in Vallejo in the last reporting year.
The overall crime rate per 100,000 people in Vallejo is 5,205.7 / 100k people.
The violent crime rate per 100,000 people in Vallejo is 973.9 / 100k people.
The property crime rate per 100,000 people in Vallejo is 4,231.9 / 100k people.
Overall, crime in Vallejo is 123.98% above the national average.
Total Crimes
Above National Average
Crime In Vallejo Comparison Table
| Statistic | Count Raw |
Vallejo / 100k People |
California / 100k People |
National / 100k People |
|---|---|---|---|---|
| Total Crimes Per 100K | 6,452 | 5,205.7 | 2,581.0 | 2,324.2 |
| Violent Crime | 1,207 | 973.9 | 442.0 | 369.8 |
| Murder | 22 | 17.8 | 5.6 | 6.3 |
| Robbery | 361 | 291.3 | 113.6 | 66.1 |
| Aggravated Assault | 734 | 592.2 | 288.7 | 268.2 |
| Property Crime | 5,245 | 4,231.9 | 2,138.9 | 1,954.4 |
| Burglary | 904 | 729.4 | 369.7 | 269.8 |
| Larceny | 3,213 | 2,592.4 | 1,341.7 | 1,401.9 |
| Car Theft | 1,128 | 910.1 | 427.6 | 282.7 |
Vallejo, CA Cost Of Living
Cost of living in Vallejo summary. We use data on the cost of living to determine how expensive it is to live in Vallejo. Real estate prices drive most of the variance in cost of living around California. Key points include:
The cost of living in Vallejo is 129 with 100 being average.
The cost of living in Vallejo is 1.3x higher than the national average.
The median home value in Vallejo is $537,019.
The median income in Vallejo is $86,112.
Vallejo's Overall Cost Of Living
Higher Than The National Average
Cost Of Living In Vallejo Comparison Table
| Living Expense | Vallejo | California | National Average | |
|---|---|---|---|---|
| Overall | 129 | 139 | 100 | |
| Services | 117 | 110 | 100 | |
| Groceries | 129 | 112 | 100 | |
| Health | 127 | 109 | 100 | |
| Housing | 137 | 204 | 100 | |
| Transportation | 135 | 126 | 100 | |
| Utilities | 131 | 124 | 100 | |
Vallejo, CA Weather
The average high in Vallejo is 72.1° and the average low is 47.9°.
There are 40.3 days of precipitation each year.
Expect an average of 21.3 inches of precipitation each year with 0.1 inches of snow.
| Stat | Vallejo |
|---|---|
| Average Annual High | 72.1 |
| Average Annual Low | 47.9 |
| Annual Precipitation Days | 40.3 |
| Average Annual Precipitation | 21.3 |
| Average Annual Snowfall | 0.1 |
Average High
Days of Rain
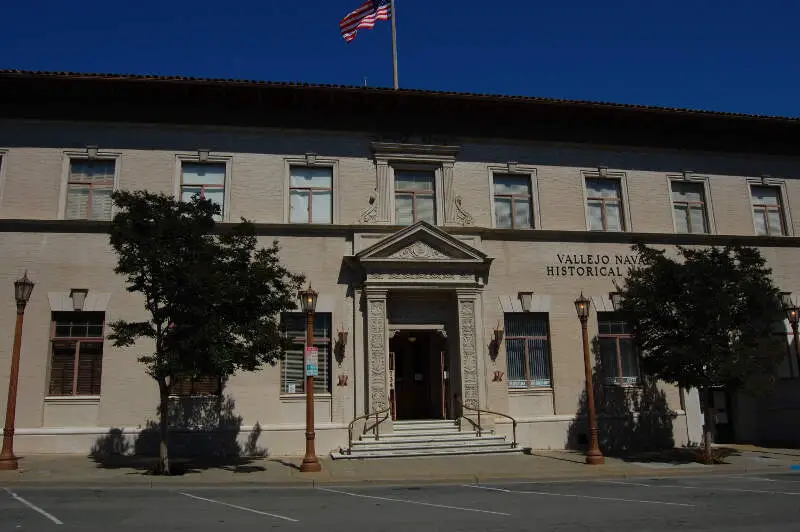
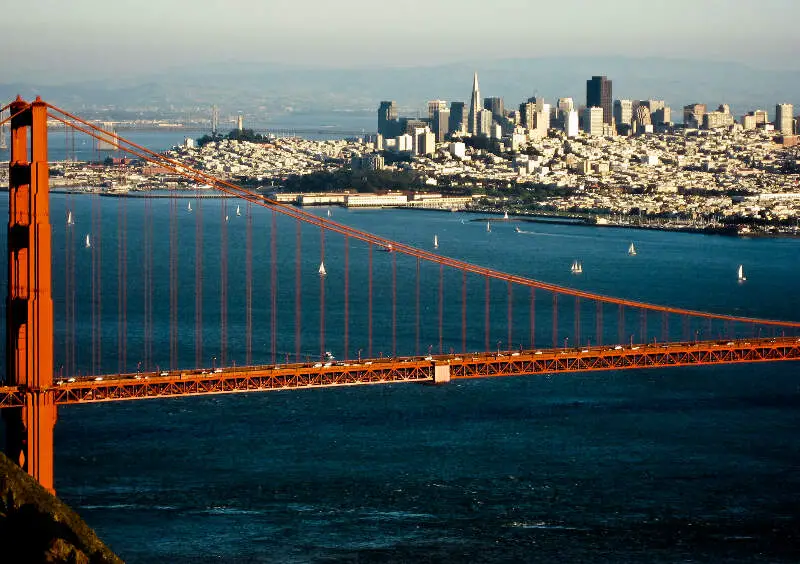
Vallejo, CA Photos
Rankings for Vallejo in California


Locations Around Vallejo
Map Of Vallejo, CA
Best Places Around Vallejo
Piedmont, CA
Population 11,161
Kensington, CA
Population 5,309
Lucas Valley-Marinwood, CA
Population 6,334
Fairfax, CA
Population 7,567
Mountain View, CA
Population 82,132
Kentfield, CA
Population 7,410
Lafayette, CA
Population 25,310
Hercules, CA
Population 26,041
Orinda, CA
Population 19,477
American Canyon, CA
Population 21,669
Vallejo Demographics And Statistics
Population over time in Vallejo
The current population in Vallejo is 125,132. The population has increased 7.8% from 2010.
| Year | Population | % Change |
|---|---|---|
| 2022 | 125,132 | 3.4% |
| 2021 | 120,977 | 0.3% |
| 2020 | 120,599 | 0.8% |
| 2019 | 119,644 | 0.5% |
| 2018 | 118,995 | 0.8% |
| 2017 | 118,078 | 0.9% |
| 2016 | 117,079 | 0.6% |
| 2015 | 116,417 | 0.3% |
| 2014 | 116,021 | -0.0% |
| 2013 | 116,030 | - |
Race / Ethnicity in Vallejo
Vallejo is:
22.6% White with 28,233 White residents.
17.8% African American with 22,326 African American residents.
0.3% American Indian with 387 American Indian residents.
22.3% Asian with 27,902 Asian residents.
0.8% Hawaiian with 1,042 Hawaiian residents.
1.2% Other with 1,512 Other residents.
5.7% Two Or More with 7,118 Two Or More residents.
29.3% Hispanic with 36,612 Hispanic residents.
| Race | Vallejo | CA | USA |
|---|---|---|---|
| White | 22.6% | 35.2% | 58.9% |
| African American | 17.8% | 5.3% | 12.1% |
| American Indian | 0.3% | 0.3% | 0.6% |
| Asian | 22.3% | 14.9% | 5.7% |
| Hawaiian | 0.8% | 0.3% | 0.2% |
| Other | 1.2% | 0.4% | 0.4% |
| Two Or More | 5.7% | 3.8% | 3.5% |
| Hispanic | 29.3% | 39.7% | 18.7% |
Gender in Vallejo
Vallejo is 51.0% female with 63,857 female residents.
Vallejo is 49.0% male with 61,275 male residents.
| Gender | Vallejo | CA | USA |
|---|---|---|---|
| Female | 51.0% | 49.9% | 50.4% |
| Male | 49.0% | 50.1% | 49.6% |
Highest level of educational attainment in Vallejo for adults over 25
7.0% of adults in Vallejo completed < 9th grade.
6.0% of adults in Vallejo completed 9-12th grade.
24.0% of adults in Vallejo completed high school / ged.
26.0% of adults in Vallejo completed some college.
10.0% of adults in Vallejo completed associate's degree.
19.0% of adults in Vallejo completed bachelor's degree.
6.0% of adults in Vallejo completed master's degree.
1.0% of adults in Vallejo completed professional degree.
1.0% of adults in Vallejo completed doctorate degree.
| Education | Vallejo | CA | USA |
|---|---|---|---|
| < 9th Grade | 7.0% | 9.0% | 4.0% |
| 9-12th Grade | 6.0% | 7.0% | 6.0% |
| High School / GED | 24.0% | 20.0% | 26.0% |
| Some College | 26.0% | 20.0% | 20.0% |
| Associate's Degree | 10.0% | 8.0% | 9.0% |
| Bachelor's Degree | 19.0% | 22.0% | 21.0% |
| Master's Degree | 6.0% | 9.0% | 10.0% |
| Professional Degree | 1.0% | 3.0% | 2.0% |
| Doctorate Degree | 1.0% | 2.0% | 2.0% |
Household Income For Vallejo, California
5.1% of households in Vallejo earn Less than $10,000.
2.9% of households in Vallejo earn $10,000 to $14,999.
5.6% of households in Vallejo earn $15,000 to $24,999.
4.7% of households in Vallejo earn $25,000 to $34,999.
9.7% of households in Vallejo earn $35,000 to $49,999.
14.5% of households in Vallejo earn $50,000 to $74,999.
14.9% of households in Vallejo earn $75,000 to $99,999.
18.9% of households in Vallejo earn $100,000 to $149,999.
11.8% of households in Vallejo earn $150,000 to $199,999.
11.9% of households in Vallejo earn $200,000 or more.
| Income | Vallejo | CA | USA |
|---|---|---|---|
| Less than $10,000 | 5.1% | 4.4% | 4.9% |
| $10,000 to $14,999 | 2.9% | 3.2% | 3.8% |
| $15,000 to $24,999 | 5.6% | 5.6% | 7.0% |
| $25,000 to $34,999 | 4.7% | 6.0% | 7.4% |
| $35,000 to $49,999 | 9.7% | 8.7% | 10.7% |
| $50,000 to $74,999 | 14.5% | 13.7% | 16.1% |
| $75,000 to $99,999 | 14.9% | 12.0% | 12.8% |
| $100,000 to $149,999 | 18.9% | 17.8% | 17.1% |
| $150,000 to $199,999 | 11.8% | 10.7% | 8.8% |
| $200,000 or more | 11.9% | 17.9% | 11.4% |


