100 Biggest Cities In Indiana For 2023
Using the latest Census data, we detail the 100 biggest cities in Indiana. You can all see a comprehensive list of all 356 cities and places in Indiana.

Article Table Of Contents
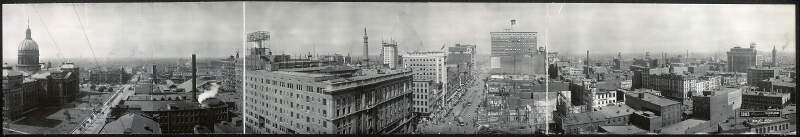
We all love the biggest cities that the Hoosier State has to offer. You know the places like Indianapolis and Fort Wayne which make all the headlines.
But there are a bunch of other great large cities in Indiana that don't get as much love.
We're going to change that right now.
Using the most recent Census data, we can tell you about all the places in Indiana with a focus on the biggest. We update the data each year and this is our fourth time doing this.
The Largest Cities In Indiana For 2023:
You can click here to see a full table of the full of the 100 biggest cities in Indiana, along with every other place over 1,000 people big. It is sortable by clicking on the headers.
Read on below to see more on the biggest cities. Or for more reading on places to live in Indiana, check out:
The 10 Biggest Cities In Indiana
/10
Rank Last Year: 1 (No Change)
Population: 869,387
Population 2010: 809,804
Growth: 7.4%
More on Indianapolis: Crime Report | Homes For Sale | Data
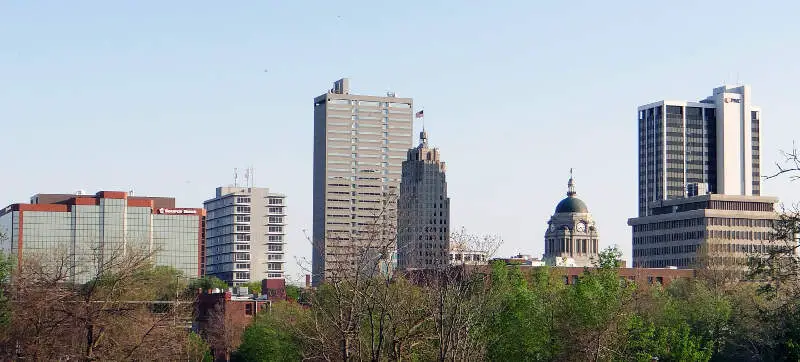
/10
Rank Last Year: 2 (No Change)
Population: 268,378
Population 2010: 253,721
Growth: 5.8%
More on Fort Wayne: Crime Report | Homes For Sale | Data
/10
Rank Last Year: 3 (No Change)
Population: 118,414
Population 2010: 118,186
Growth: 0.2%
More on Evansville: Crime Report | Homes For Sale | Data

/10
Rank Last Year: 4 (No Change)
Population: 102,686
Population 2010: 102,073
Growth: 0.6%
More on South Bend: Crime Report | Homes For Sale | Data
/10
Rank Last Year: 5 (No Change)
Population: 99,130
Population 2010: 76,771
Growth: 29.1%
More on Carmel: Crime Report | Homes For Sale | Data
/10
Rank Last Year: 6 (No Change)
Population: 88,717
Population 2010: 71,746
Growth: 23.7%
More on Fishers: Crime Report | Homes For Sale | Data
/10
Rank Last Year: 7 (No Change)
Population: 84,691
Population 2010: 78,490
Growth: 7.9%
More on Bloomington: Crime Report | Homes For Sale | Data
/10
Rank Last Year: 8 (No Change)
Population: 76,141
Population 2010: 81,312
Growth: -6.4%
More on Hammond: Crime Report | Homes For Sale | Data
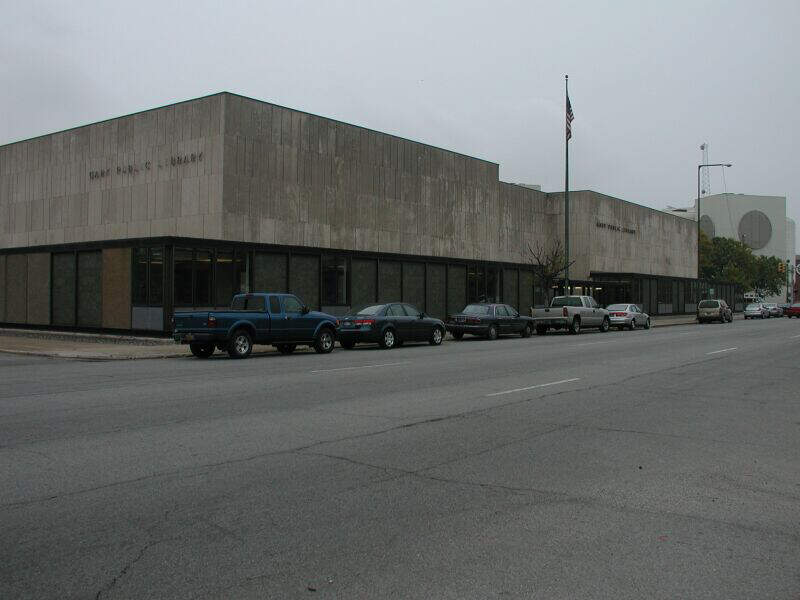
/10
Rank Last Year: 9 (No Change)
Population: 75,486
Population 2010: 84,407
Growth: -10.6%
More on Gary: Crime Report | Homes For Sale | Data
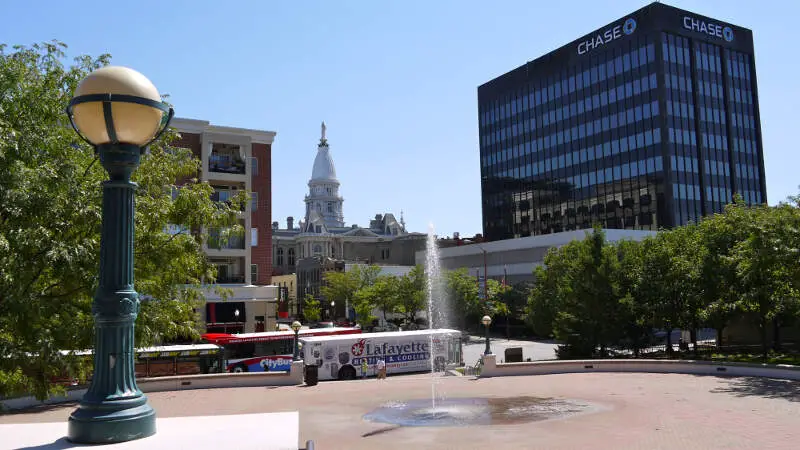
/10
Rank Last Year: 10 (No Change)
Population: 72,556
Population 2010: 66,148
Growth: 9.7%
More on Lafayette: Crime Report | Homes For Sale | Data
How We Determined The Largest Cities In Indiana
We've been ranking and dissecting cities in the Hoosier State for over 4 years now -- making this actually the fourth time we've run the numbers. We always use the best data, the US Census. In this case, that means we are using the 2013-2017 American Community Survey.
It what is probably the most simple analysis we run each year, we ranked every place in Indiana from biggest to smallest. The biggest city this year? That would be Indianapolis.
The smallest? Brook, although there are places smaller than 1,000 people not listed here, so keep that in mind as we take a look at the top ten.
Now on to numbers 11-100 Biggest in Indiana
We hope that you find the big city, or really any city, that's right for you. Below is a list of the rest of the biggest cities along with every other place in Indiana.
Have fun snacking around in the Hoosier State!
For more reading on Indiana, check out:
- Best Places To Raise A Family In Indiana
- Best Places To Retire In Indiana
- Richest Cities In Indiana
- Safest Places In Indiana
- Worst Places To Live In Indiana
- Most Expensive Places To Live In Indiana
Detailed List Of The Biggest Cities In Indiana
| Rank | City | Current Population | 2010 | Growth | |||||
|---|---|---|---|---|---|---|---|---|---|
| 1 | Indianapolis | 869,387 | 809,804 | 7.4% | |||||
| 2 | Fort Wayne | 268,378 | 253,721 | 5.8% | |||||
| 3 | Evansville | 118,414 | 118,186 | 0.2% | |||||
| 4 | South Bend | 102,686 | 102,073 | 0.6% | |||||
| 5 | Carmel | 99,130 | 76,771 | 29.1% | |||||
| 6 | Fishers | 88,717 | 71,746 | 23.7% | |||||
| 7 | Bloomington | 84,691 | 78,490 | 7.9% | |||||
| 8 | Hammond | 76,141 | 81,312 | -6.4% | |||||
| 9 | Gary | 75,486 | 84,407 | -10.6% | |||||
| 10 | Lafayette | 72,556 | 66,148 | 9.7% | |||||
| 11 | Muncie | 67,739 | 70,017 | -3.3% | |||||
| 12 | Noblesville | 64,430 | 48,712 | 32.3% | |||||
| 13 | Terre Haute | 60,690 | 60,440 | 0.4% | |||||
| 14 | Greenwood | 58,784 | 47,565 | 23.6% | |||||
| 15 | Kokomo | 58,066 | 45,886 | 26.5% | |||||
| 16 | Anderson | 54,476 | 56,767 | -4.0% | |||||
| 17 | Elkhart | 52,657 | 51,837 | 1.6% | |||||
| 18 | Mishawaka | 49,675 | 47,891 | 3.7% | |||||
| 19 | West Lafayette | 49,668 | 29,344 | 69.3% | |||||
| 20 | Lawrence | 49,020 | 44,424 | 10.3% | |||||
| 21 | Columbus | 48,820 | 43,314 | 12.7% | |||||
| 22 | Jeffersonville | 47,932 | 42,148 | 13.7% | |||||
| 23 | Westfield | 41,652 | 0 | nan% | |||||
| 24 | New Albany | 36,730 | 36,434 | 0.8% | |||||
| 25 | Portage | 36,524 | 36,291 | 0.6% | |||||
| 26 | Richmond | 35,467 | 37,125 | -4.5% | |||||
| 27 | Merrillville | 34,871 | 34,428 | 1.3% | |||||
| 28 | Goshen | 34,586 | 31,261 | 10.6% | |||||
| 29 | Plainfield | 34,224 | 26,643 | 28.5% | |||||
| 30 | Valparaiso | 33,707 | 30,990 | 8.8% | |||||
| 31 | Michigan City | 31,191 | 31,613 | -1.3% | |||||
| 32 | Granger | 30,499 | 28,365 | 7.5% | |||||
| 33 | Crown Point | 30,372 | 26,078 | 16.5% | |||||
| 34 | Schererville | 28,559 | 28,478 | 0.3% | |||||
| 35 | Hobart | 28,120 | 28,389 | -0.9% | |||||
| 36 | East Chicago | 28,044 | 30,218 | -7.2% | |||||
| 37 | Zionsville | 28,035 | 13,444 | 108.5% | |||||
| 38 | Marion | 27,730 | 30,703 | -9.7% | |||||
| 39 | Brownsburg | 26,560 | 20,573 | 29.1% | |||||
| 40 | Franklin | 25,276 | 22,508 | 12.3% | |||||
| 41 | Munster | 22,604 | 23,254 | -2.8% | |||||
| 42 | Greenfield | 22,561 | 19,732 | 14.3% | |||||
| 43 | Highland | 22,479 | 23,710 | -5.2% | |||||
| 44 | Clarksville | 21,825 | 22,947 | -4.9% | |||||
| 45 | La Porte | 21,328 | 22,192 | -3.9% | |||||
| 46 | Seymour | 19,780 | 17,922 | 10.4% | |||||
| 47 | Shelbyville | 18,918 | 18,877 | 0.2% | |||||
| 48 | St. John | 18,382 | 13,733 | 33.9% | |||||
| 49 | Avon | 18,056 | 11,653 | 54.9% | |||||
| 50 | Logansport | 17,968 | 18,098 | -0.7% | |||||
| 51 | New Castle | 17,234 | 18,206 | -5.3% | |||||
| 52 | Vincennes | 17,091 | 18,369 | -7.0% | |||||
| 53 | Huntington | 17,083 | 17,479 | -2.3% | |||||
| 54 | Lebanon | 16,317 | 15,769 | 3.5% | |||||
| 55 | Griffith | 16,198 | 16,959 | -4.5% | |||||
| 56 | Crawfordsville | 16,088 | 15,893 | 1.2% | |||||
| 57 | New Haven | 15,934 | 13,857 | 15.0% | |||||
| 58 | Dyer | 15,933 | 15,957 | -0.2% | |||||
| 59 | Warsaw | 15,757 | 13,381 | 17.8% | |||||
| 60 | Jasper | 15,681 | 14,572 | 7.6% | |||||
| 61 | Frankfort | 15,569 | 16,459 | -5.4% | |||||
| 62 | Beech Grove | 15,148 | 14,027 | 8.0% | |||||
| 63 | Chesterton | 13,884 | 13,154 | 5.5% | |||||
| 64 | Bedford | 13,246 | 13,516 | -2.0% | |||||
| 65 | Auburn | 13,209 | 12,482 | 5.8% | |||||
| 66 | Connersville | 13,096 | 13,616 | -3.8% | |||||
| 67 | Cedar Lake | 12,830 | 11,136 | 15.2% | |||||
| 68 | Washington | 12,514 | 11,411 | 9.7% | |||||
| 69 | Speedway | 12,327 | 11,931 | 3.3% | |||||
| 70 | Lake Station | 11,952 | 12,833 | -6.9% | |||||
| 71 | Martinsville | 11,807 | 11,936 | -1.1% | |||||
| 72 | Madison | 11,783 | 11,986 | -1.7% | |||||
| 73 | Peru | 11,369 | 11,563 | -1.7% | |||||
| 74 | Greensburg | 11,221 | 11,190 | 0.3% | |||||
| 75 | Yor | 11,128 | 9,227 | 20.6% | |||||
| 76 | Danville | 10,380 | 8,692 | 19.4% | |||||
| 77 | Greencastle | 10,312 | 10,357 | -0.4% | |||||
| 78 | Bluffton | 10,298 | 9,531 | 8.0% | |||||
| 79 | Plymouth | 10,029 | 10,044 | -0.1% | |||||
| 80 | Wabash | 10,017 | 10,847 | -7.7% | |||||
| 81 | Lowell | 9,793 | 8,964 | 9.2% | |||||
| 82 | Mooresville | 9,727 | 9,348 | 4.1% | |||||
| 83 | Decatur | 9,700 | 9,901 | -2.0% | |||||
| 84 | Kendallville | 9,365 | 9,666 | -3.1% | |||||
| 85 | Sellersburg | 9,320 | 6,115 | 52.4% | |||||
| 86 | Columbia City | 9,115 | 8,207 | 11.1% | |||||
| 87 | Whitestown | 8,842 | 1,915 | 361.7% | |||||
| 88 | Princeton | 8,716 | 8,631 | 1.0% | |||||
| 89 | Angola | 8,706 | 8,424 | 3.3% | |||||
| 90 | Elwood | 8,435 | 8,885 | -5.1% | |||||
| 91 | Charlestown | 8,290 | 7,472 | 10.9% | |||||
| 92 | Brazil | 8,225 | 7,532 | 9.2% | |||||
| 93 | Bargersville | 7,417 | 3,888 | 90.8% | |||||
| 94 | Dunlap | 7,273 | 5,805 | 25.3% | |||||
| 95 | Tell City | 7,243 | 7,367 | -1.7% | |||||
| 96 | Mccordsville | 7,237 | 4,187 | 72.8% | |||||
| 97 | Hunte | 7,224 | 4,702 | 53.6% | |||||
| 98 | North Vernon | 7,167 | 6,365 | 12.6% | |||||
| 99 | Nappanee | 7,138 | 6,742 | 5.9% | |||||
| 100 | Lakes Of The Four Seasons | 7,081 | 7,548 | -6.2% | |||||
| 101 | Batesville | 6,945 | 6,436 | 7.9% | |||||
| 102 | Scottsburg | 6,715 | 6,672 | 0.6% | |||||
| 103 | Notre Dame | 6,699 | 7,429 | -9.8% | |||||
| 104 | Ellettsville | 6,650 | 6,159 | 8.0% | |||||
| 105 | Mount Vernon | 6,535 | 6,788 | -3.7% | |||||
| 106 | Boonville | 6,512 | 6,332 | 2.8% | |||||
| 107 | Garrett | 6,507 | 5,919 | 9.9% | |||||
| 108 | Huntingburg | 6,301 | 5,821 | 8.2% | |||||
| 109 | Rushville | 6,194 | 6,681 | -7.3% | |||||
| 110 | Salem | 6,193 | 6,338 | -2.3% | |||||
| 111 | New Whiteland | 6,178 | 5,338 | 15.7% | |||||
| 112 | Rensselaer | 6,151 | 6,248 | -1.6% | |||||
| 113 | Rochester | 6,026 | 6,209 | -2.9% | |||||
| 114 | Portland | 5,972 | 6,500 | -8.1% | |||||
| 115 | Winfield | 5,879 | 3,956 | 48.6% | |||||
| 116 | Cumberland | 5,840 | 5,785 | 1.0% | |||||
| 117 | Westville | 5,822 | 5,705 | 2.1% | |||||
| 118 | Bright | 5,801 | 5,266 | 10.2% | |||||
| 119 | Hartford City | 5,781 | 6,491 | -10.9% | |||||
| 120 | Gas City | 5,756 | 5,910 | -2.6% | |||||
| 121 | North Manchester | 5,612 | 5,973 | -6.0% | |||||
| 122 | Linton | 5,293 | 5,456 | -3.0% | |||||
| 123 | Monticello | 5,255 | 5,430 | -3.2% | |||||
| 124 | Simonton Lake | 5,081 | 5,042 | 0.8% | |||||
| 125 | Hidden Valley | 5,075 | 5,070 | 0.1% | |||||
| 126 | South Haven | 5,017 | 5,333 | -5.9% | |||||
| 127 | Lawrenceburg | 5,009 | 4,995 | 0.3% | |||||
| 128 | Alexandria | 4,985 | 5,300 | -5.9% | |||||
| 129 | Tipton | 4,974 | 5,185 | -4.1% | |||||
| 130 | Cicero | 4,921 | 4,783 | 2.9% | |||||
| 131 | Winona Lake | 4,902 | 4,746 | 3.3% | |||||
| 132 | Porter | 4,835 | 4,914 | -1.6% | |||||
| 133 | Whiting | 4,801 | 5,021 | -4.4% | |||||
| 134 | Winchester | 4,763 | 4,918 | -3.2% | |||||
| 135 | Clinton | 4,679 | 4,945 | -5.4% | |||||
| 136 | Fortville | 4,666 | 3,826 | 22.0% | |||||
| 137 | Edinburgh | 4,661 | 3,906 | 19.3% | |||||
| 138 | Whiteland | 4,495 | 4,219 | 6.5% | |||||
| 139 | Ligonier | 4,489 | 4,286 | 4.7% | |||||
| 140 | Bremen | 4,484 | 4,598 | -2.5% | |||||
| 141 | Pendleton | 4,429 | 4,419 | 0.2% | |||||
| 142 | North Terre Haute | 4,371 | 4,658 | -6.2% | |||||
| 143 | Mitchell | 4,272 | 4,488 | -4.8% | |||||
| 144 | De Motte | 4,093 | 3,735 | 9.6% | |||||
| 145 | Sullivan | 4,081 | 4,316 | -5.4% | |||||
| 146 | Berne | 3,994 | 4,074 | -2.0% | |||||
| 147 | Aurora | 3,948 | 3,671 | 7.5% | |||||
| 148 | Greendale | 3,903 | 4,560 | -14.4% | |||||
| 149 | Austin | 3,854 | 4,101 | -6.0% | |||||
| 150 | Leo-Cedarville | 3,814 | 3,464 | 10.1% | |||||
| 151 | Upland | 3,701 | 4,125 | -10.3% | |||||
| 152 | Hebron | 3,685 | 3,510 | 5.0% | |||||
| 153 | Chandler | 3,669 | 2,841 | 29.1% | |||||
| 154 | Paoli | 3,633 | 4,015 | -9.5% | |||||
| 155 | Middlebury | 3,582 | 3,364 | 6.5% | |||||
| 156 | Knox | 3,553 | 3,694 | -3.8% | |||||
| 157 | Roselawn | 3,519 | 3,807 | -7.6% | |||||
| 158 | Pittsboro | 3,518 | 2,725 | 29.1% | |||||
| 159 | Melody Hill | 3,481 | 3,455 | 0.8% | |||||
| 160 | Sheridan | 3,454 | 2,692 | 28.3% | |||||
| 161 | Hanover | 3,418 | 3,376 | 1.2% | |||||
| 162 | Smithville-Sanders | 3,411 | 2,496 | 36.7% | |||||
| 163 | Union City | 3,385 | 3,683 | -8.1% | |||||
| 164 | Fort Branch | 3,381 | 2,927 | 15.5% | |||||
| 165 | Ossian | 3,352 | 3,526 | -4.9% | |||||
| 166 | Osceola | 3,323 | 2,365 | 40.5% | |||||
| 167 | Georg | 3,305 | 2,756 | 19.9% | |||||
| 168 | Newburgh | 3,263 | 3,258 | 0.2% | |||||
| 169 | Attica | 3,256 | 3,269 | -0.4% | |||||
| 170 | Country Squire Lakes | 3,220 | 3,592 | -10.4% | |||||
| 171 | Corydon | 3,154 | 3,073 | 2.6% | |||||
| 172 | Delphi | 2,979 | 3,112 | -4.3% | |||||
| 173 | Shorewood Forest | 2,931 | 3,015 | -2.8% | |||||
| 174 | Brown | 2,920 | 2,933 | -0.4% | |||||
| 175 | Heritage Lake | 2,917 | 2,604 | 12.0% | |||||
| 176 | Butler | 2,889 | 2,834 | 1.9% | |||||
| 177 | Syracuse | 2,874 | 2,877 | -0.1% | |||||
| 178 | Albion | 2,789 | 2,716 | 2.7% | |||||
| 179 | Lagrange | 2,751 | 2,749 | 0.1% | |||||
| 180 | Avilla | 2,725 | 2,217 | 22.9% | |||||
| 181 | Bicknell | 2,715 | 3,235 | -16.1% | |||||
| 182 | Fairmount | 2,671 | 2,797 | -4.5% | |||||
| 183 | Winamac | 2,634 | 2,678 | -1.6% | |||||
| 184 | Brooklyn | 2,633 | 1,458 | 80.6% | |||||
| 185 | Chesterfield | 2,601 | 2,608 | -0.3% | |||||
| 186 | Centerville | 2,587 | 2,547 | 1.6% | |||||
| 187 | Loogootee | 2,579 | 2,974 | -13.3% | |||||
| 188 | Covington | 2,572 | 2,482 | 3.6% | |||||
| 189 | Oakland City | 2,570 | 2,349 | 9.4% | |||||
| 190 | Brookville | 2,535 | 2,682 | -5.5% | |||||
| 191 | Santa Claus | 2,495 | 2,592 | -3.7% | |||||
| 192 | Ingalls | 2,494 | 1,903 | 31.1% | |||||
| 193 | Bloomfield | 2,488 | 2,403 | 3.5% | |||||
| 194 | Middl | 2,472 | 2,318 | 6.6% | |||||
| 195 | New Palestine | 2,456 | 2,253 | 9.0% | |||||
| 196 | Lapel | 2,379 | 2,357 | 0.9% | |||||
| 197 | Grissom Afb | 2,368 | 1,830 | 29.4% | |||||
| 198 | Albany | 2,365 | 2,129 | 11.1% | |||||
| 199 | Fremont | 2,345 | 2,189 | 7.1% | |||||
| 200 | Walkerton | 2,344 | 2,297 | 2.0% | |||||
| 201 | Kouts | 2,330 | 1,833 | 27.1% | |||||
| 202 | Petersburg | 2,315 | 2,406 | -3.8% | |||||
| 203 | Rockville | 2,304 | 2,649 | -13.0% | |||||
| 204 | Rockport | 2,291 | 2,033 | 12.7% | |||||
| 205 | Shadeland | 2,260 | 1,579 | 43.1% | |||||
| 206 | Knight | 2,260 | 2,112 | 7.0% | |||||
| 207 | Spencer | 2,224 | 2,517 | -11.6% | |||||
| 208 | Waterloo | 2,217 | 2,181 | 1.7% | |||||
| 209 | Fowler | 2,205 | 2,299 | -4.1% | |||||
| 210 | West Terre Haute | 2,193 | 1,876 | 16.9% | |||||
| 211 | Orleans | 2,192 | 1,925 | 13.9% | |||||
| 212 | New Carlisle | 2,169 | 1,840 | 17.9% | |||||
| 213 | North Judson | 2,139 | 1,731 | 23.6% | |||||
| 214 | Ferdinand | 2,133 | 2,157 | -1.1% | |||||
| 215 | Milan | 2,114 | 1,693 | 24.9% | |||||
| 216 | Rising Sun | 2,108 | 2,478 | -14.9% | |||||
| 217 | Burns Harbor | 2,107 | 1,252 | 68.3% | |||||
| 218 | Frankton | 2,107 | 1,942 | 8.5% | |||||
| 219 | Wakarusa | 2,074 | 1,828 | 13.5% | |||||
| 220 | Edgewood | 2,050 | 2,126 | -3.6% | |||||
| 221 | Gree | 2,028 | 1,992 | 1.8% | |||||
| 222 | Veedersburg | 1,989 | 2,035 | -2.3% | |||||
| 223 | Hager | 1,970 | 1,663 | 18.5% | |||||
| 224 | Eaton | 1,959 | 1,888 | 3.8% | |||||
| 225 | Bourbon | 1,942 | 1,797 | 8.1% | |||||
| 226 | Salt Creek Commons | 1,941 | 2,198 | -11.7% | |||||
| 227 | Dunkirk | 1,923 | 2,437 | -21.1% | |||||
| 228 | Trail Creek | 1,919 | 1,977 | -2.9% | |||||
| 229 | Hope | 1,919 | 1,866 | 2.8% | |||||
| 230 | Cloverdale | 1,905 | 2,335 | -18.4% | |||||
| 231 | Churubusco | 1,901 | 1,910 | -0.5% | |||||
| 232 | Jasonville | 1,885 | 2,324 | -18.9% | |||||
| 233 | Southport | 1,879 | 1,589 | 18.3% | |||||
| 234 | Flora | 1,856 | 2,147 | -13.6% | |||||
| 235 | New Chicago | 1,846 | 2,108 | -12.4% | |||||
| 236 | North Liberty | 1,822 | 1,569 | 16.1% | |||||
| 237 | Kentland | 1,809 | 1,997 | -9.4% | |||||
| 238 | Argos | 1,799 | 1,570 | 14.6% | |||||
| 239 | Vevay | 1,798 | 1,994 | -9.8% | |||||
| 240 | Battle Ground | 1,796 | 1,466 | 22.5% | |||||
| 241 | French Lick | 1,792 | 1,921 | -6.7% | |||||
| 242 | Montpelier | 1,790 | 1,404 | 27.5% | |||||
| 243 | Lake Dalecarlia | 1,779 | 1,514 | 17.5% | |||||
| 244 | Crothersville | 1,771 | 1,797 | -1.4% | |||||
| 245 | Williamsport | 1,753 | 2,436 | -28.0% | |||||
| 246 | Haubstadt | 1,738 | 2,491 | -30.2% | |||||
| 247 | Versailles | 1,719 | 1,763 | -2.5% | |||||
| 248 | Harlan | 1,715 | 1,824 | -6.0% | |||||
| 249 | Meridian Hills | 1,712 | 1,630 | 5.0% | |||||
| 250 | Hamilton | 1,702 | 1,599 | 6.4% | |||||
| 251 | Aberdeen | 1,698 | 2,186 | -22.3% | |||||
| 252 | Henryville | 1,698 | 2,201 | -22.9% | |||||
| 253 | Milford | 1,664 | 1,576 | 5.6% | |||||
| 254 | Princes Lakes | 1,659 | 1,172 | 41.6% | |||||
| 255 | Liberty | 1,655 | 2,040 | -18.9% | |||||
| 256 | Rossville | 1,654 | 1,450 | 14.1% | |||||
| 257 | Monon | 1,650 | 1,555 | 6.1% | |||||
| 258 | Cambridge City | 1,648 | 1,997 | -17.5% | |||||
| 259 | Osgood | 1,576 | 1,741 | -9.5% | |||||
| 260 | Roanoke | 1,572 | 1,806 | -13.0% | |||||
| 261 | Daleville | 1,565 | 2,080 | -24.8% | |||||
| 262 | Shelburn | 1,553 | 1,501 | 3.5% | |||||
| 263 | Palmyra | 1,553 | 696 | 123.1% | |||||
| 264 | Bristol | 1,539 | 1,633 | -5.8% | |||||
| 265 | Worthington | 1,539 | 1,943 | -20.8% | |||||
| 266 | Tri-Lakes | 1,531 | 1,649 | -7.2% | |||||
| 267 | Arcadia | 1,530 | 1,492 | 2.5% | |||||
| 268 | Nashville | 1,521 | 849 | 79.2% | |||||
| 269 | South Whitley | 1,512 | 2,026 | -25.4% | |||||
| 270 | Dillsboro | 1,498 | 1,343 | 11.5% | |||||
| 271 | Redkey | 1,493 | 1,250 | 19.4% | |||||
| 272 | Markle | 1,481 | 1,224 | 21.0% | |||||
| 273 | Warren Park | 1,477 | 1,387 | 6.5% | |||||
| 274 | New Paris | 1,464 | 1,311 | 11.7% | |||||
| 275 | Odon | 1,453 | 1,685 | -13.8% | |||||
| 276 | Borden | 1,448 | 796 | 81.9% | |||||
| 277 | Oolitic | 1,443 | 1,361 | 6.0% | |||||
| 278 | Dale | 1,442 | 1,763 | -18.2% | |||||
| 279 | Rome City | 1,439 | 1,395 | 3.2% | |||||
| 280 | Remington | 1,403 | 1,284 | 9.3% | |||||
| 281 | Brookston | 1,398 | 1,880 | -25.6% | |||||
| 282 | Owensville | 1,391 | 1,546 | -10.0% | |||||
| 283 | Woodburn | 1,390 | 1,557 | -10.7% | |||||
| 284 | Monrovia | 1,383 | 910 | 52.0% | |||||
| 285 | Kingsford Heights | 1,381 | 1,579 | -12.5% | |||||
| 286 | Greenville | 1,380 | 566 | 143.8% | |||||
| 287 | Lake Holiday | 1,376 | 1,106 | 24.4% | |||||
| 288 | Koontz Lake | 1,368 | 1,623 | -15.7% | |||||
| 289 | Clermont | 1,365 | 1,376 | -0.8% | |||||
| 290 | Dayton | 1,359 | 958 | 41.9% | |||||
| 291 | Cannelton | 1,353 | 1,334 | 1.4% | |||||
| 292 | Oxford | 1,353 | 1,149 | 17.8% | |||||
| 293 | Morga | 1,352 | 1,062 | 27.3% | |||||
| 294 | Galveston | 1,349 | 1,305 | 3.4% | |||||
| 295 | Fish Lake | 1,335 | 895 | 49.2% | |||||
| 296 | Bass Lake | 1,332 | 1,419 | -6.1% | |||||
| 297 | Cordry Sweetwater Lakes | 1,323 | 1,190 | 11.2% | |||||
| 298 | Mulberry | 1,319 | 1,200 | 9.9% | |||||
| 299 | Monroeville | 1,315 | 961 | 36.8% | |||||
| 300 | Lynn | 1,314 | 1,179 | 11.5% | |||||
| 301 | Jonesboro | 1,302 | 1,579 | -17.5% | |||||
| 302 | Russiaville | 1,289 | 1,210 | 6.5% | |||||
| 303 | Hudson Lake | 1,285 | 1,344 | -4.4% | |||||
| 304 | Mexico | 1,283 | 700 | 83.3% | |||||
| 305 | Cayuga | 1,282 | 1,188 | 7.9% | |||||
| 306 | Grabill | 1,278 | 1,000 | 27.8% | |||||
| 307 | Ladoga | 1,274 | 955 | 33.4% | |||||
| 308 | Clay City | 1,273 | 986 | 29.1% | |||||
| 309 | Farmersburg | 1,256 | 1,076 | 16.7% | |||||
| 310 | Galena | 1,253 | 1,880 | -33.4% | |||||
| 311 | Sunman | 1,251 | 1,223 | 2.3% | |||||
| 312 | Westport | 1,250 | 1,227 | 1.9% | |||||
| 313 | Farmland | 1,247 | 1,570 | -20.6% | |||||
| 314 | Wolcott | 1,244 | 1,094 | 13.7% | |||||
| 315 | Trafalgar | 1,244 | 1,099 | 13.2% | |||||
| 316 | Fairview Park | 1,242 | 1,367 | -9.1% | |||||
| 317 | Culver | 1,230 | 1,444 | -14.8% | |||||
| 318 | Geneva | 1,227 | 1,228 | -0.1% | |||||
| 319 | Warren | 1,199 | 1,182 | 1.4% | |||||
| 320 | Mentone | 1,199 | 721 | 66.3% | |||||
| 321 | Wanatah | 1,198 | 1,077 | 11.2% | |||||
| 322 | Darmstadt | 1,189 | 1,323 | -10.1% | |||||
| 323 | Andrews | 1,174 | 1,322 | -11.2% | |||||
| 324 | Sweetser | 1,157 | 863 | 34.1% | |||||
| 325 | New Pekin | 1,149 | 1,703 | -32.5% | |||||
| 326 | Pierceton | 1,145 | 1,017 | 12.6% | |||||
| 327 | Akron | 1,142 | 1,212 | -5.8% | |||||
| 328 | Morristown | 1,139 | 1,030 | 10.6% | |||||
| 329 | Converse | 1,139 | 1,310 | -13.1% | |||||
| 330 | Ogden Dunes | 1,132 | 1,226 | -7.7% | |||||
| 331 | Kirklin | 1,125 | 914 | 23.1% | |||||
| 332 | La Fontaine | 1,113 | 711 | 56.5% | |||||
| 333 | Parker City | 1,111 | 1,209 | -8.1% | |||||
| 334 | Morocco | 1,097 | 878 | 24.9% | |||||
| 335 | Jame | 1,092 | 894 | 22.1% | |||||
| 336 | North Webster | 1,088 | 1,160 | -6.2% | |||||
| 337 | St. Paul | 1,088 | 1,034 | 5.2% | |||||
| 338 | Thor | 1,077 | 1,435 | -24.9% | |||||
| 339 | Grandview | 1,071 | 752 | 42.4% | |||||
| 340 | Lynnville | 1,071 | 845 | 26.7% | |||||
| 341 | Medora | 1,066 | 450 | 136.9% | |||||
| 342 | Silver Lake | 1,059 | 927 | 14.2% | |||||
| 343 | Seelyville | 1,055 | 925 | 14.1% | |||||
| 344 | Shirley | 1,055 | 759 | 39.0% | |||||
| 345 | Gosport | 1,052 | 966 | 8.9% | |||||
| 346 | Ashley | 1,051 | 1,096 | -4.1% | |||||
| 347 | St. Leon | 1,041 | 823 | 26.5% | |||||
| 348 | Goodland | 1,037 | 1,202 | -13.7% | |||||
| 349 | Shipshewana | 1,031 | 597 | 72.7% | |||||
| 350 | Monroe City | 1,027 | 548 | 87.4% | |||||
| 351 | Montgomery | 1,025 | 396 | 158.8% | |||||
| 352 | Long Beach | 1,024 | 1,462 | -30.0% | |||||
| 353 | Otterbein | 1,023 | 1,124 | -9.0% | |||||
| 354 | Poseyville | 1,010 | 1,084 | -6.8% | |||||
| 355 | Wayn | 1,007 | 1,027 | -1.9% | |||||
| 356 | Brook | 1,000 | 1,072 | -6.7% | |||||