100 Biggest Cities In Minnesota For 2023
Using the latest Census data, we detail the 100 biggest cities in Minnesota. You can all see a comprehensive list of all 360 cities and places in Minnesota.

Article Table Of Contents
We all love the biggest cities that the North Star State has to offer. You know the places like Minneapolis and St. Paul which make all the headlines.
But there are a bunch of other great large cities in Minnesota that don't get as much love.
We're going to change that right now.
Using the most recent Census data, we can tell you about all the places in Minnesota with a focus on the biggest. We update the data each year and this is our fourth time doing this.
The Largest Cities In Minnesota For 2023:
You can click here to see a full table of the full of the 100 biggest cities in Minnesota, along with every other place over 1,000 people big. It is sortable by clicking on the headers.
Read on below to see more on the biggest cities. Or for more reading on places to live in Minnesota, check out:
- Best Places To Live In Minnesota
- Cheapest Places To Live In Minnesota
- Most Dangerous Cities In Minnesota
The 10 Biggest Cities In Minnesota
/10
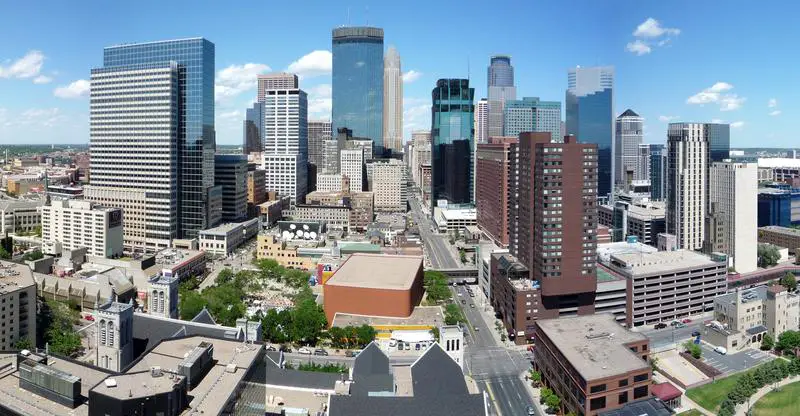
Rank Last Year: 1 (No Change)
Population: 424,536
Population 2010: 379,631
Growth: 11.8%
More on Minneapolis: Crime Report | Homes For Sale | Data
/10
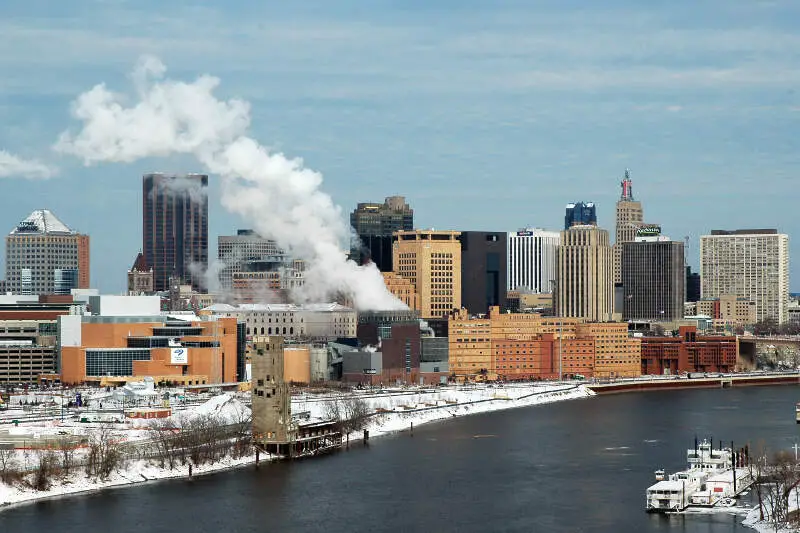
Rank Last Year: 2 (No Change)
Population: 305,877
Population 2010: 282,079
Growth: 8.4%
More on St. Paul: Crime Report | Homes For Sale | Data
/10
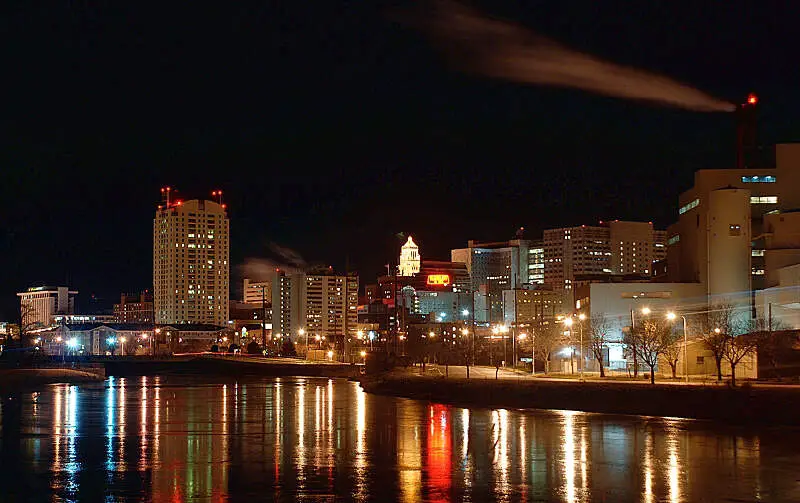
Rank Last Year: 3 (No Change)
Population: 117,134
Population 2010: 104,201
Growth: 12.4%
More on Rochester: Crime Report | Homes For Sale | Data
/10
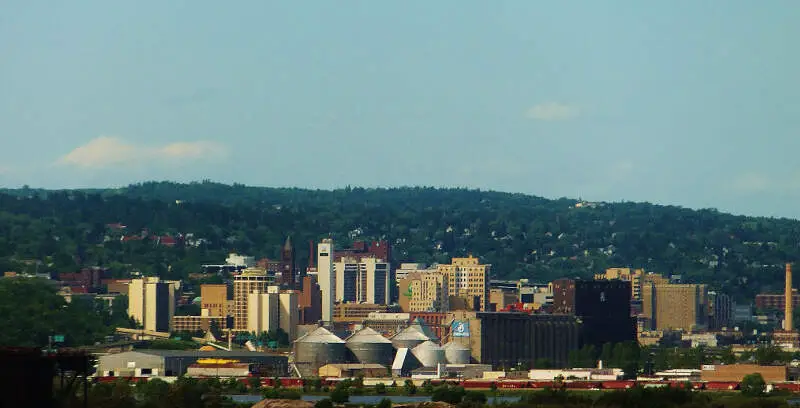
Rank Last Year: 4 (No Change)
Population: 85,852
Population 2010: 86,066
Growth: -0.2%
More on Duluth: Crime Report | Homes For Sale | Data
/10
Rank Last Year: 5 (No Change)
Population: 85,226
Population 2010: 82,621
Growth: 3.2%
More on Bloomington: Crime Report | Homes For Sale | Data
/10
Rank Last Year: 6 (No Change)
Population: 80,173
Population 2010: 73,642
Growth: 8.9%
More on Brooklyn Park: Crime Report | Homes For Sale | Data
/10
Rank Last Year: 7 (No Change)
Population: 78,879
Population 2010: 69,171
Growth: 14.0%
More on Plymouth: Crime Report | Homes For Sale | Data
/10
Rank Last Year: 9 (Up 1)
Population: 71,569
Population 2010: 59,039
Growth: 21.2%
More on Maple Grove: Crime Report | Homes For Sale | Data
/10
Rank Last Year: 10 (Up 1)
Population: 71,298
Population 2010: 59,447
Growth: 19.9%
More on Woodbury: Crime Report | Homes For Sale | Data
/10
Rank Last Year: 8 (Down 2)
Population: 68,390
Population 2010: 65,163
Growth: 5.0%
More on St. Cloud: Crime Report | Homes For Sale | Data
How We Determined The Largest Cities In Minnesota
We've been ranking and dissecting cities in the North Star State for over 4 years now -- making this actually the fourth time we've run the numbers. We always use the best data, the US Census. In this case, that means we are using the 2013-2017 American Community Survey.
It what is probably the most simple analysis we run each year, we ranked every place in Minnesota from biggest to smallest. The biggest city this year? That would be Minneapolis.
The smallest? Le Roy, although there are places smaller than 1,000 people not listed here, so keep that in mind as we take a look at the top ten.
Now on to numbers 11-100 Biggest in Minnesota
We hope that you find the big city, or really any city, that's right for you. Below is a list of the rest of the biggest cities along with every other place in Minnesota.
Have fun snacking around in the North Star State!
For more reading on Minnesota, check out:
- Best Places To Raise A Family In Minnesota
- Best Places To Retire In Minnesota
- Richest Cities In Minnesota
- Safest Places In Minnesota
- Worst Places To Live In Minnesota
- Most Expensive Places To Live In Minnesota
Detailed List Of The Biggest Cities In Minnesota
| Rank | City | Current Population | 2010 | Growth | |||||
|---|---|---|---|---|---|---|---|---|---|
| 1 | Minneapolis | 424,536 | 379,631 | 11.8% | |||||
| 2 | St. Paul | 305,877 | 282,079 | 8.4% | |||||
| 3 | Rochester | 117,134 | 104,201 | 12.4% | |||||
| 4 | Duluth | 85,852 | 86,066 | -0.2% | |||||
| 5 | Bloomington | 85,226 | 82,621 | 3.2% | |||||
| 6 | Brooklyn Park | 80,173 | 73,642 | 8.9% | |||||
| 7 | Plymouth | 78,879 | 69,171 | 14.0% | |||||
| 8 | Maple Grove | 71,569 | 59,039 | 21.2% | |||||
| 9 | Woodbury | 71,298 | 59,447 | 19.9% | |||||
| 10 | St. Cloud | 68,390 | 65,163 | 5.0% | |||||
| 11 | Eagan | 66,377 | 64,494 | 2.9% | |||||
| 12 | Lakeville | 65,710 | 53,984 | 21.7% | |||||
| 13 | Blaine | 65,048 | 55,413 | 17.4% | |||||
| 14 | Eden Prairie | 64,481 | 59,219 | 8.9% | |||||
| 15 | Coon Rapids | 62,706 | 61,990 | 1.2% | |||||
| 16 | Burnsville | 61,536 | 60,693 | 1.4% | |||||
| 17 | Minnetonka | 53,760 | 49,567 | 8.5% | |||||
| 18 | Apple Valley | 53,728 | 48,751 | 10.2% | |||||
| 19 | Edina | 52,215 | 47,445 | 10.1% | |||||
| 20 | St. Louis Park | 48,874 | 44,665 | 9.4% | |||||
| 21 | Moorhead | 43,409 | 36,721 | 18.2% | |||||
| 22 | Mankato | 42,685 | 38,187 | 11.8% | |||||
| 23 | Shakopee | 41,423 | 35,075 | 18.1% | |||||
| 24 | Maplewood | 40,684 | 37,085 | 9.7% | |||||
| 25 | Cottage Grove | 37,120 | 34,025 | 9.1% | |||||
| 26 | Richfield | 36,253 | 34,773 | 4.3% | |||||
| 27 | Roseville | 36,139 | 33,261 | 8.7% | |||||
| 28 | Inver Grove Heights | 35,492 | 33,353 | 6.4% | |||||
| 29 | Andover | 33,019 | 30,097 | 9.7% | |||||
| 30 | Savage | 31,758 | 26,609 | 19.4% | |||||
| 31 | Brooklyn Center | 30,755 | 29,673 | 3.6% | |||||
| 32 | Oakdale | 27,925 | 27,378 | 2.0% | |||||
| 33 | Fridley | 27,789 | 27,467 | 1.2% | |||||
| 34 | Ramsey | 27,201 | 22,925 | 18.7% | |||||
| 35 | Shoreview | 26,922 | 24,901 | 8.1% | |||||
| 36 | Prior Lake | 26,775 | 22,193 | 20.6% | |||||
| 37 | Winona | 26,772 | 27,663 | -3.2% | |||||
| 38 | Chaska | 26,753 | 22,993 | 16.4% | |||||
| 39 | Chanhassen | 25,965 | 22,851 | 13.6% | |||||
| 40 | White Bear Lake | 25,718 | 23,461 | 9.6% | |||||
| 41 | Owatonna | 25,716 | 25,319 | 1.6% | |||||
| 42 | Austin | 25,180 | 24,439 | 3.0% | |||||
| 43 | Champlin | 24,980 | 22,741 | 9.8% | |||||
| 44 | Elk River | 24,894 | 22,514 | 10.6% | |||||
| 45 | Rosemount | 24,792 | 20,708 | 19.7% | |||||
| 46 | Faribault | 23,853 | 23,034 | 3.6% | |||||
| 47 | Farmington | 22,996 | 19,659 | 17.0% | |||||
| 48 | Crystal | 22,937 | 22,059 | 4.0% | |||||
| 49 | Hastings | 22,796 | 21,591 | 5.6% | |||||
| 50 | New Brighton | 22,663 | 21,327 | 6.3% | |||||
| 51 | Lino Lakes | 21,748 | 19,784 | 9.9% | |||||
| 52 | Golden Valley | 21,611 | 20,184 | 7.1% | |||||
| 53 | New Hope | 20,913 | 20,281 | 3.1% | |||||
| 54 | Northfield | 20,399 | 19,414 | 5.1% | |||||
| 55 | Forest Lake | 20,393 | 17,747 | 14.9% | |||||
| 56 | Columbia Heights | 20,247 | 19,501 | 3.8% | |||||
| 57 | South St. Paul | 20,132 | 20,286 | -0.8% | |||||
| 58 | West St. Paul | 19,805 | 19,640 | 0.8% | |||||
| 59 | Willmar | 19,728 | 19,335 | 2.0% | |||||
| 60 | Stillwater | 19,471 | 17,804 | 9.4% | |||||
| 61 | Sartell | 18,439 | 14,756 | 25.0% | |||||
| 62 | Hopkins | 18,400 | 17,420 | 5.6% | |||||
| 63 | St. Michael | 17,871 | 15,384 | 16.2% | |||||
| 64 | Albert Lea | 17,804 | 18,088 | -1.6% | |||||
| 65 | Anoka | 17,512 | 17,449 | 0.4% | |||||
| 66 | Otsego | 17,429 | 12,521 | 39.2% | |||||
| 67 | Ham Lake | 16,630 | 14,953 | 11.2% | |||||
| 68 | Buffalo | 16,413 | 14,771 | 11.1% | |||||
| 69 | Red Wing | 16,366 | 16,449 | -0.5% | |||||
| 70 | Hibbing | 15,923 | 16,396 | -2.9% | |||||
| 71 | Bemidji | 15,277 | 13,209 | 15.7% | |||||
| 72 | Hugo | 15,008 | 12,129 | 23.7% | |||||
| 73 | Robbinsdale | 14,393 | 13,878 | 3.7% | |||||
| 74 | Hutchinson | 13,935 | 14,188 | -1.8% | |||||
| 75 | Sauk Rapids | 13,926 | 12,482 | 11.6% | |||||
| 76 | North Mankato | 13,903 | 13,147 | 5.8% | |||||
| 77 | Fergus Falls | 13,754 | 13,353 | 3.0% | |||||
| 78 | Alexandria | 13,705 | 11,094 | 23.5% | |||||
| 79 | Monticello | 13,700 | 12,230 | 12.0% | |||||
| 80 | Marshall | 13,604 | 13,428 | 1.3% | |||||
| 81 | Vadnais Heights | 13,565 | 12,281 | 10.5% | |||||
| 82 | Brainerd | 13,423 | 13,741 | -2.3% | |||||
| 83 | New Ulm | 13,209 | 13,509 | -2.2% | |||||
| 84 | Mounds View | 13,193 | 12,107 | 9.0% | |||||
| 85 | Rogers | 13,183 | 7,661 | 72.1% | |||||
| 86 | Worthington | 13,093 | 12,357 | 6.0% | |||||
| 87 | North St. Paul | 12,421 | 11,387 | 9.1% | |||||
| 88 | Waconia | 12,281 | 10,159 | 20.9% | |||||
| 89 | Cloquet | 11,994 | 12,019 | -0.2% | |||||
| 90 | East Bethel | 11,958 | 11,600 | 3.1% | |||||
| 91 | St. Peter | 11,934 | 11,017 | 8.3% | |||||
| 92 | Mendota Heights | 11,339 | 11,220 | 1.1% | |||||
| 93 | Grand Rapids | 11,218 | 10,762 | 4.2% | |||||
| 94 | Big Lake | 11,085 | 9,659 | 14.8% | |||||
| 95 | North Branch | 10,585 | 9,978 | 6.1% | |||||
| 96 | Little Canada | 10,423 | 9,668 | 7.8% | |||||
| 97 | Arden Hills | 10,276 | 9,498 | 8.2% | |||||
| 98 | Fairmont | 10,042 | 10,629 | -5.5% | |||||
| 99 | Victoria | 9,787 | 6,954 | 40.7% | |||||
| 100 | Hermantown | 9,577 | 9,149 | 4.7% | |||||
| 101 | Mound | 9,498 | 9,037 | 5.1% | |||||
| 102 | Detroit Lakes | 9,229 | 8,472 | 8.9% | |||||
| 103 | Lake Elmo | 9,071 | 7,878 | 15.1% | |||||
| 104 | St. Anthony | 9,035 | 8,106 | 11.5% | |||||
| 105 | Cambridge | 8,975 | 7,868 | 14.1% | |||||
| 106 | Waseca | 8,892 | 9,426 | -5.7% | |||||
| 107 | Oak Grove | 8,819 | 7,881 | 11.9% | |||||
| 108 | Thief River Falls | 8,792 | 8,554 | 2.8% | |||||
| 109 | Little Falls | 8,663 | 8,350 | 3.7% | |||||
| 110 | East Grand Forks | 8,555 | 8,386 | 2.0% | |||||
| 111 | Virginia | 8,421 | 8,766 | -3.9% | |||||
| 112 | Baxter | 8,326 | 7,342 | 13.4% | |||||
| 113 | Mahtomedi | 8,232 | 7,699 | 6.9% | |||||
| 114 | Orono | 8,217 | 7,386 | 11.3% | |||||
| 115 | New Prague | 8,022 | 7,017 | 14.3% | |||||
| 116 | Minnetrista | 7,989 | 5,976 | 33.7% | |||||
| 117 | Wyoming | 7,976 | 7,680 | 3.9% | |||||
| 118 | Shorewood | 7,939 | 7,267 | 9.2% | |||||
| 119 | St. Francis | 7,793 | 6,853 | 13.7% | |||||
| 120 | Waite Park | 7,719 | 6,720 | 14.9% | |||||
| 121 | Crookston | 7,711 | 7,900 | -2.4% | |||||
| 122 | Albertville | 7,483 | 6,548 | 14.3% | |||||
| 123 | St. Joseph | 7,448 | 6,246 | 19.2% | |||||
| 124 | Belle Plaine | 7,137 | 6,325 | 12.8% | |||||
| 125 | Litchfield | 6,640 | 6,747 | -1.6% | |||||
| 126 | Spring Lake Park | 6,582 | 6,531 | 0.8% | |||||
| 127 | Medina | 6,549 | 4,680 | 39.9% | |||||
| 128 | Kasson | 6,425 | 5,703 | 12.7% | |||||
| 129 | Jordan | 6,289 | 5,341 | 17.7% | |||||
| 130 | Dayton | 6,258 | 4,672 | 33.9% | |||||
| 131 | Delano | 6,167 | 5,301 | 16.3% | |||||
| 132 | Stewartville | 6,123 | 5,861 | 4.5% | |||||
| 133 | Corcoran | 6,113 | 5,380 | 13.6% | |||||
| 134 | Isanti | 6,016 | 4,873 | 23.5% | |||||
| 135 | International Falls | 5,876 | 6,469 | -9.2% | |||||
| 136 | Zimmerman | 5,831 | 4,954 | 17.7% | |||||
| 137 | Falcon Heights | 5,586 | 5,276 | 5.9% | |||||
| 138 | Byron | 5,536 | 4,693 | 18.0% | |||||
| 139 | Glencoe | 5,488 | 5,670 | -3.2% | |||||
| 140 | Carver | 5,438 | 3,337 | 63.0% | |||||
| 141 | St. Paul Park | 5,404 | 5,264 | 2.7% | |||||
| 142 | Morris | 5,320 | 5,258 | 1.2% | |||||
| 143 | North Oaks | 5,244 | 4,316 | 21.5% | |||||
| 144 | Chisago City | 5,159 | 4,881 | 5.7% | |||||
| 145 | La Crescent | 5,135 | 4,918 | 4.4% | |||||
| 146 | Montevideo | 5,071 | 5,357 | -5.3% | |||||
| 147 | Lake City | 5,050 | 5,367 | -5.9% | |||||
| 148 | Redwood Falls | 4,977 | 5,257 | -5.3% | |||||
| 149 | Circle Pines | 4,951 | 4,914 | 0.8% | |||||
| 150 | Becker | 4,919 | 4,342 | 13.3% | |||||
| 151 | Oak Park Heights | 4,914 | 4,284 | 14.7% | |||||
| 152 | Chisholm | 4,879 | 4,954 | -1.5% | |||||
| 153 | Nowthen | 4,715 | 4,319 | 9.2% | |||||
| 154 | Elko New Market | 4,715 | 3,622 | 30.2% | |||||
| 155 | Princeton | 4,701 | 4,671 | 0.6% | |||||
| 156 | Lindstrom | 4,662 | 4,298 | 8.5% | |||||
| 157 | Wayzata | 4,591 | 3,717 | 23.5% | |||||
| 158 | Luverne | 4,557 | 4,666 | -2.3% | |||||
| 159 | Rockford | 4,481 | 4,180 | 7.2% | |||||
| 160 | Watertown | 4,473 | 4,081 | 9.6% | |||||
| 161 | Sauk Centre | 4,466 | 4,273 | 4.5% | |||||
| 162 | Dilworth | 4,430 | 3,820 | 16.0% | |||||
| 163 | Windom | 4,423 | 4,598 | -3.8% | |||||
| 164 | St. James | 4,414 | 4,567 | -3.4% | |||||
| 165 | Cold Spring | 4,238 | 3,896 | 8.8% | |||||
| 166 | Park Rapids | 4,151 | 3,757 | 10.5% | |||||
| 167 | Wadena | 4,145 | 4,182 | -0.9% | |||||
| 168 | Scandia | 4,135 | 3,911 | 5.7% | |||||
| 169 | Goodview | 4,132 | 3,989 | 3.6% | |||||
| 170 | Columbus | 4,109 | 3,945 | 4.2% | |||||
| 171 | Grant | 4,106 | 4,109 | -0.1% | |||||
| 172 | Lonsdale | 4,102 | 3,323 | 23.4% | |||||
| 173 | Cannon Falls | 4,053 | 4,072 | -0.5% | |||||
| 174 | Pipestone | 4,046 | 4,284 | -5.6% | |||||
| 175 | Le Sueur | 4,028 | 4,123 | -2.3% | |||||
| 176 | Centerville | 4,006 | 3,716 | 7.8% | |||||
| 177 | Deephaven | 3,904 | 3,657 | 6.8% | |||||
| 178 | St. Augusta | 3,785 | 3,222 | 17.5% | |||||
| 179 | Independence | 3,778 | 3,426 | 10.3% | |||||
| 180 | Bayport | 3,758 | 3,441 | 9.2% | |||||
| 181 | St. Charles | 3,749 | 3,689 | 1.6% | |||||
| 182 | Norwood Young America | 3,746 | 3,535 | 6.0% | |||||
| 183 | Newport | 3,664 | 3,501 | 4.7% | |||||
| 184 | Melrose | 3,651 | 3,523 | 3.6% | |||||
| 185 | Pine Island | 3,629 | 3,249 | 11.7% | |||||
| 186 | Eveleth | 3,592 | 3,727 | -3.6% | |||||
| 187 | Mora | 3,519 | 3,611 | -2.5% | |||||
| 188 | Two Harbors | 3,511 | 3,718 | -5.6% | |||||
| 189 | Perham | 3,506 | 2,951 | 18.8% | |||||
| 190 | Montrose | 3,505 | 2,610 | 34.3% | |||||
| 191 | Zumbrota | 3,452 | 3,181 | 8.5% | |||||
| 192 | Annandale | 3,420 | 3,195 | 7.0% | |||||
| 193 | Hanover | 3,414 | 2,753 | 24.0% | |||||
| 194 | Sleepy Eye | 3,378 | 3,613 | -6.5% | |||||
| 195 | Ely | 3,338 | 3,520 | -5.2% | |||||
| 196 | Long Prairie | 3,308 | 3,417 | -3.2% | |||||
| 197 | Plainview | 3,292 | 3,328 | -1.1% | |||||
| 198 | Jackson | 3,208 | 3,320 | -3.4% | |||||
| 199 | Breckenridge | 3,198 | 3,387 | -5.6% | |||||
| 200 | Rush City | 3,175 | 3,038 | 4.5% | |||||
| 201 | Blue Earth | 3,128 | 3,401 | -8.0% | |||||
| 202 | Pine City | 3,113 | 3,226 | -3.5% | |||||
| 203 | Eagle Lake | 3,064 | 2,423 | 26.5% | |||||
| 204 | Benson | 3,063 | 3,162 | -3.1% | |||||
| 205 | Proctor | 3,039 | 3,001 | 1.3% | |||||
| 206 | Greenfield | 3,013 | 2,662 | 13.2% | |||||
| 207 | Afton | 3,008 | 2,891 | 4.0% | |||||
| 208 | Montgomery | 3,008 | 3,022 | -0.5% | |||||
| 209 | Milaca | 2,894 | 2,951 | -1.9% | |||||
| 210 | Mountain Iron | 2,854 | 2,876 | -0.8% | |||||
| 211 | Moose Lake | 2,804 | 2,696 | 4.0% | |||||
| 212 | Crosby | 2,780 | 2,305 | 20.6% | |||||
| 213 | Caledonia | 2,759 | 2,901 | -4.9% | |||||
| 214 | Dodge Center | 2,750 | 2,600 | 5.8% | |||||
| 215 | Osseo | 2,738 | 2,394 | 14.4% | |||||
| 216 | Albany | 2,735 | 2,431 | 12.5% | |||||
| 217 | Cokato | 2,726 | 2,753 | -1.0% | |||||
| 218 | Cohasset | 2,710 | 2,665 | 1.7% | |||||
| 219 | Chatfield | 2,690 | 2,827 | -4.8% | |||||
| 220 | Roseau | 2,686 | 2,683 | 0.1% | |||||
| 221 | Foley | 2,658 | 2,554 | 4.1% | |||||
| 222 | Wabasha | 2,655 | 2,546 | 4.3% | |||||
| 223 | Le Center | 2,651 | 2,550 | 4.0% | |||||
| 224 | Granite Falls | 2,636 | 2,995 | -12.0% | |||||
| 225 | Lauderdale | 2,624 | 2,438 | 7.6% | |||||
| 226 | Sandstone | 2,624 | 2,690 | -2.5% | |||||
| 227 | Staples | 2,613 | 3,469 | -24.7% | |||||
| 228 | Barnesville | 2,589 | 2,467 | 4.9% | |||||
| 229 | Rockville | 2,571 | 2,161 | 19.0% | |||||
| 230 | Glenwood | 2,563 | 2,581 | -0.7% | |||||
| 231 | Madelia | 2,539 | 2,606 | -2.6% | |||||
| 232 | Paynesville | 2,525 | 2,268 | 11.3% | |||||
| 233 | Pelican Rapids | 2,512 | 2,684 | -6.4% | |||||
| 234 | Janesville | 2,502 | 1,975 | 26.7% | |||||
| 235 | Lake Crystal | 2,496 | 2,534 | -1.5% | |||||
| 236 | Arlington | 2,451 | 2,228 | 10.0% | |||||
| 237 | Excelsior | 2,414 | 2,241 | 7.7% | |||||
| 238 | Olivia | 2,397 | 2,504 | -4.3% | |||||
| 239 | Breezy Point | 2,396 | 1,821 | 31.6% | |||||
| 240 | Spring Valley | 2,395 | 2,553 | -6.2% | |||||
| 241 | Crosslake | 2,389 | 1,806 | 32.3% | |||||
| 242 | Wells | 2,367 | 2,212 | 7.0% | |||||
| 243 | Mayer | 2,313 | 1,227 | 88.5% | |||||
| 244 | Lexington | 2,276 | 2,215 | 2.8% | |||||
| 245 | Aitkin | 2,253 | 2,328 | -3.2% | |||||
| 246 | Esko | 2,222 | 1,881 | 18.1% | |||||
| 247 | Cologne | 2,199 | 1,488 | 47.8% | |||||
| 248 | Eyota | 2,183 | 2,148 | 1.6% | |||||
| 249 | Tracy | 2,180 | 2,285 | -4.6% | |||||
| 250 | Maple Lake | 2,162 | 1,923 | 12.4% | |||||
| 251 | Spring Park | 2,136 | 1,467 | 45.6% | |||||
| 252 | Pequot Lakes | 2,128 | 2,318 | -8.2% | |||||
| 253 | Hoyt Lakes | 2,099 | 2,066 | 1.6% | |||||
| 254 | Springfield | 2,097 | 2,100 | -0.1% | |||||
| 255 | Hawley | 2,075 | 1,813 | 14.5% | |||||
| 256 | Warroad | 2,051 | 1,506 | 36.2% | |||||
| 257 | Winsted | 2,036 | 2,318 | -12.2% | |||||
| 258 | Mountain Lake | 2,022 | 2,006 | 0.8% | |||||
| 259 | Ortonville | 2,017 | 1,876 | 7.5% | |||||
| 260 | St. Bonifacius | 2,017 | 2,313 | -12.8% | |||||
| 261 | Stacy | 1,960 | 1,511 | 29.7% | |||||
| 262 | Gaylord | 1,958 | 2,218 | -11.7% | |||||
| 263 | Slayton | 1,953 | 2,191 | -10.9% | |||||
| 264 | Blooming Prairie | 1,939 | 1,827 | 6.1% | |||||
| 265 | Ada | 1,912 | 1,604 | 19.2% | |||||
| 266 | Howard Lake | 1,897 | 1,636 | 16.0% | |||||
| 267 | Kenyon | 1,865 | 1,844 | 1.1% | |||||
| 268 | Waterville | 1,841 | 1,783 | 3.3% | |||||
| 269 | Gilbert | 1,828 | 1,770 | 3.3% | |||||
| 270 | Lewiston | 1,828 | 1,832 | -0.2% | |||||
| 271 | Rock Creek | 1,801 | 1,614 | 11.6% | |||||
| 272 | Long Lake | 1,779 | 1,842 | -3.4% | |||||
| 273 | Rushford | 1,774 | 2,105 | -15.7% | |||||
| 274 | Dundas | 1,761 | 1,055 | 66.9% | |||||
| 275 | Osakis | 1,744 | 1,704 | 2.3% | |||||
| 276 | Nisswa | 1,742 | 2,180 | -20.1% | |||||
| 277 | Maple Plain | 1,737 | 1,675 | 3.7% | |||||
| 278 | Rice | 1,734 | 1,016 | 70.7% | |||||
| 279 | Lakeland | 1,723 | 1,789 | -3.7% | |||||
| 280 | Braham | 1,721 | 1,643 | 4.7% | |||||
| 281 | Lester Prairie | 1,719 | 1,725 | -0.3% | |||||
| 282 | Lakefield | 1,683 | 1,759 | -4.3% | |||||
| 283 | Aurora | 1,679 | 1,481 | 13.4% | |||||
| 284 | Coleraine | 1,660 | 1,946 | -14.7% | |||||
| 285 | Madison | 1,647 | 1,549 | 6.3% | |||||
| 286 | Clearwater | 1,636 | 1,286 | 27.2% | |||||
| 287 | Silver Bay | 1,610 | 2,055 | -21.7% | |||||
| 288 | Mapleton | 1,606 | 1,874 | -14.3% | |||||
| 289 | Warren | 1,601 | 1,793 | -10.7% | |||||
| 290 | Red Lake | 1,593 | 1,296 | 22.9% | |||||
| 291 | Pierz | 1,573 | 1,401 | 12.3% | |||||
| 292 | Canby | 1,558 | 1,677 | -7.1% | |||||
| 293 | Avon | 1,547 | 1,278 | 21.0% | |||||
| 294 | Oronoco | 1,517 | 974 | 55.7% | |||||
| 295 | Waverly | 1,513 | 1,070 | 41.4% | |||||
| 296 | Clara City | 1,510 | 1,229 | 22.9% | |||||
| 297 | Dawson | 1,507 | 1,542 | -2.3% | |||||
| 298 | Redby | 1,500 | 1,321 | 13.6% | |||||
| 299 | Hinckley | 1,499 | 2,071 | -27.6% | |||||
| 300 | Tonka Bay | 1,466 | 1,450 | 1.1% | |||||
| 301 | Babbitt | 1,454 | 1,357 | 7.1% | |||||
| 302 | Fosston | 1,451 | 1,734 | -16.3% | |||||
| 303 | Spring Grove | 1,446 | 1,362 | 6.2% | |||||
| 304 | Dassel | 1,443 | 1,261 | 14.4% | |||||
| 305 | Grand Marais | 1,426 | 1,226 | 16.3% | |||||
| 306 | Wheaton | 1,401 | 1,557 | -10.0% | |||||
| 307 | Frazee | 1,388 | 1,364 | 1.8% | |||||
| 308 | Richmond | 1,384 | 1,320 | 4.8% | |||||
| 309 | Glyndon | 1,362 | 1,159 | 17.5% | |||||
| 310 | Starbuck | 1,351 | 1,325 | 2.0% | |||||
| 311 | Appleton | 1,339 | 2,178 | -38.5% | |||||
| 312 | Red Lake Falls | 1,319 | 1,468 | -10.1% | |||||
| 313 | Winthrop | 1,317 | 1,304 | 1.0% | |||||
| 314 | Spicer | 1,316 | 1,247 | 5.5% | |||||
| 315 | Fulda | 1,314 | 1,439 | -8.7% | |||||
| 316 | Bagley | 1,308 | 1,458 | -10.3% | |||||
| 317 | Minneota | 1,307 | 1,193 | 9.6% | |||||
| 318 | Hayfield | 1,299 | 1,190 | 9.2% | |||||
| 319 | Dellwood | 1,295 | 1,076 | 20.4% | |||||
| 320 | Tyler | 1,289 | 1,007 | 28.0% | |||||
| 321 | Renville | 1,271 | 1,348 | -5.7% | |||||
| 322 | Winnebago | 1,261 | 1,572 | -19.8% | |||||
| 323 | Edgerton | 1,257 | 1,185 | 6.1% | |||||
| 324 | Keewatin | 1,255 | 1,132 | 10.9% | |||||
| 325 | New York Mills | 1,249 | 1,378 | -9.4% | |||||
| 326 | New London | 1,249 | 1,248 | 0.1% | |||||
| 327 | Adrian | 1,233 | 1,091 | 13.0% | |||||
| 328 | Medford | 1,220 | 1,282 | -4.8% | |||||
| 329 | Preston | 1,192 | 1,338 | -10.9% | |||||
| 330 | Goodhue | 1,191 | 1,161 | 2.6% | |||||
| 331 | Elgin | 1,189 | 1,301 | -8.6% | |||||
| 332 | Royalton | 1,186 | 1,048 | 13.2% | |||||
| 333 | Cottonwood | 1,180 | 994 | 18.7% | |||||
| 334 | Elbow Lake | 1,166 | 1,413 | -17.5% | |||||
| 335 | Taylors Falls | 1,166 | 1,016 | 14.8% | |||||
| 336 | Mahnomen | 1,160 | 1,563 | -25.8% | |||||
| 337 | Shafer | 1,155 | 910 | 26.9% | |||||
| 338 | Atwater | 1,141 | 1,029 | 10.9% | |||||
| 339 | Fairfax | 1,135 | 1,185 | -4.2% | |||||
| 340 | Parkers Prairie | 1,119 | 953 | 17.4% | |||||
| 341 | Wanamingo | 1,117 | 1,000 | 11.7% | |||||
| 342 | Nashwauk | 1,104 | 1,129 | -2.2% | |||||
| 343 | Scanlon | 1,103 | 913 | 20.8% | |||||
| 344 | Grand Meadow | 1,095 | 925 | 18.4% | |||||
| 345 | Hector | 1,093 | 1,080 | 1.2% | |||||
| 346 | Lake St. Croix Beach | 1,091 | 1,045 | 4.4% | |||||
| 347 | Buhl | 1,089 | 891 | 22.2% | |||||
| 348 | Truman | 1,083 | 1,263 | -14.3% | |||||
| 349 | Madison Lake | 1,081 | 1,007 | 7.3% | |||||
| 350 | Birchwood Village | 1,067 | 852 | 25.2% | |||||
| 351 | Menahga | 1,053 | 1,132 | -7.0% | |||||
| 352 | New Richland | 1,039 | 1,062 | -2.2% | |||||
| 353 | Nicollet | 1,037 | 1,066 | -2.7% | |||||
| 354 | Sherburn | 1,032 | 950 | 8.6% | |||||
| 355 | Harmony | 1,028 | 987 | 4.2% | |||||
| 356 | Belgrade | 1,027 | 758 | 35.5% | |||||
| 357 | Eden Valley | 1,017 | 923 | 10.2% | |||||
| 358 | Hilltop | 1,007 | 568 | 77.3% | |||||
| 359 | Carlton | 1,006 | 803 | 25.3% | |||||
| 360 | Le Roy | 1,006 | 833 | 20.8% | |||||