100 Biggest Cities In Montana For 2023
Using the latest Census data, we detail the 100 biggest cities in Montana. You can all see a comprehensive list of all 91 cities and places in Montana.

Article Table Of Contents
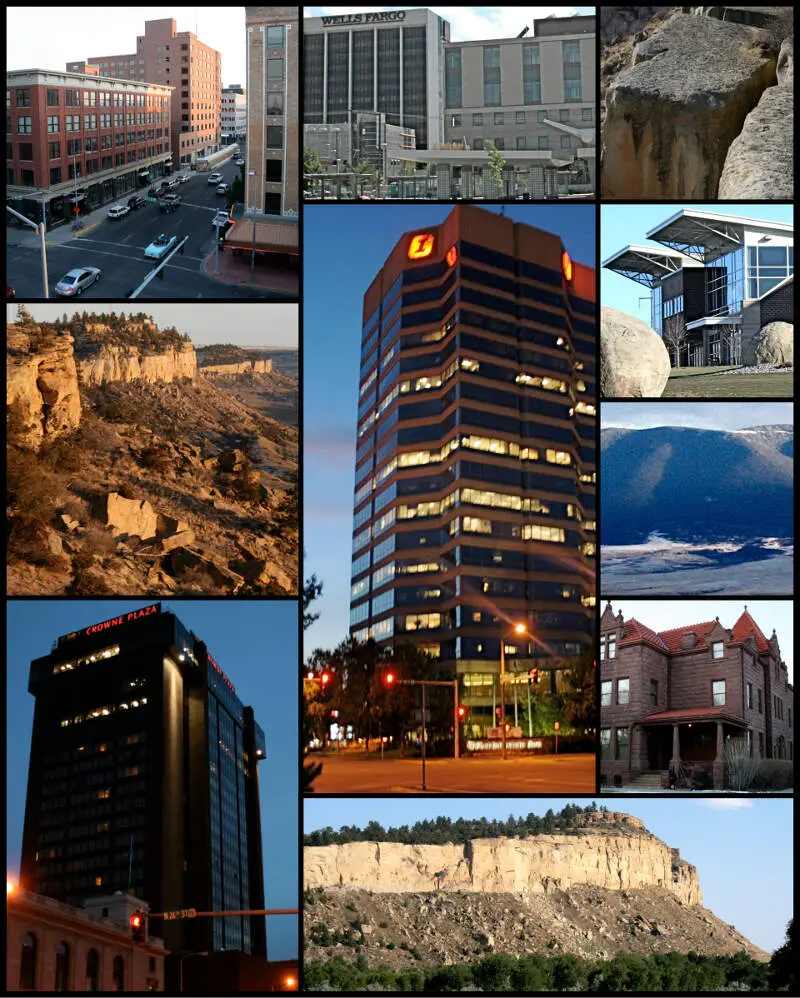
We all love the biggest cities that the Treasure State has to offer. You know the places like Billings and Missoula which make all the headlines.
But there are a bunch of other great large cities in Montana that don't get as much love.
We're going to change that right now.
Using the most recent Census data, we can tell you about all the places in Montana with a focus on the biggest. We update the data each year and this is our fourth time doing this.
The Largest Cities In Montana For 2023:
You can click here to see a full table of the full of the 100 biggest cities in Montana, along with every other place over 1,000 people big. It is sortable by clicking on the headers.
Read on below to see more on the biggest cities. Or for more reading on places to live in Montana, check out:
The 10 Biggest Cities In Montana
/10
Rank Last Year: 1 (No Change)
Population: 109,705
Population 2010: 101,549
Growth: 8.0%
More on Billings: Crime Report | Homes For Sale | Data
/10
Rank Last Year: 2 (No Change)
Population: 74,994
Population 2010: 65,383
Growth: 14.7%
More on Missoula: Crime Report | Homes For Sale | Data
/10
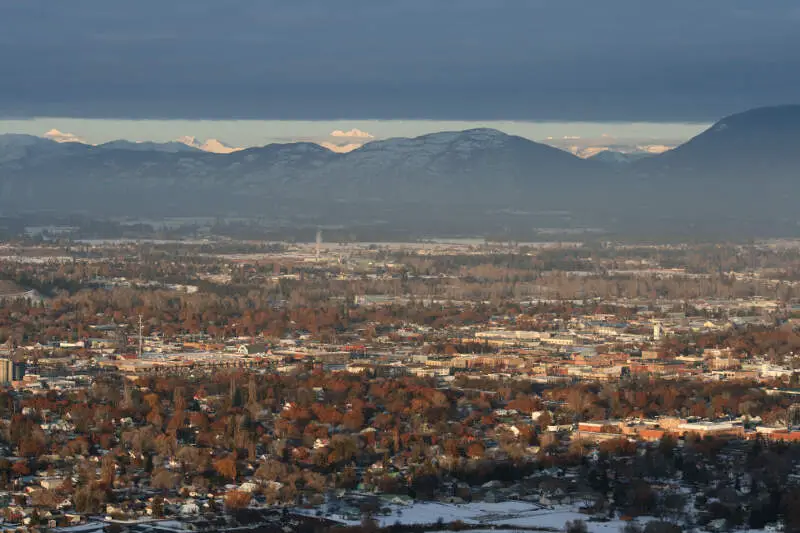
Rank Last Year: 3 (No Change)
Population: 58,717
Population 2010: 57,873
Growth: 1.5%
More on Great Falls: Homes For Sale | Data
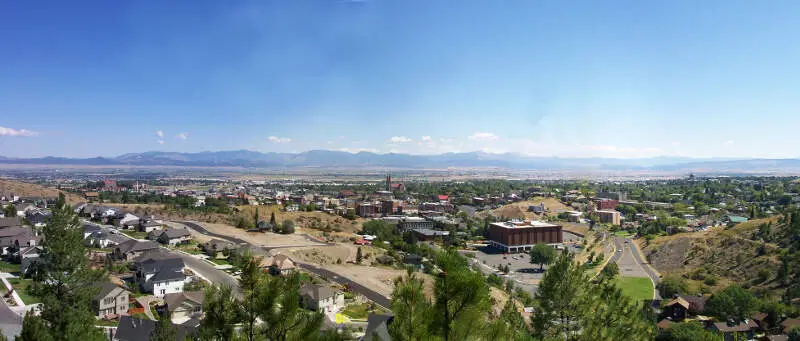
/10
Rank Last Year: 4 (No Change)
Population: 48,330
Population 2010: 36,440
Growth: 32.6%
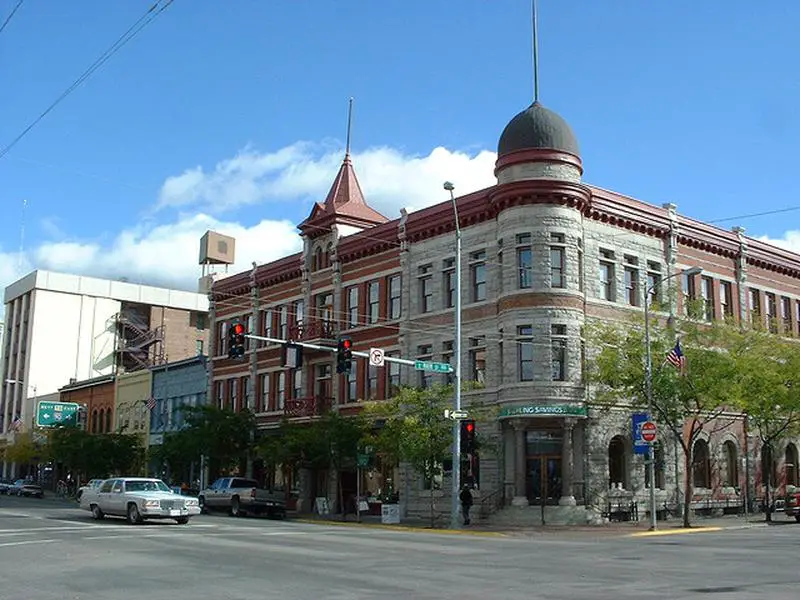
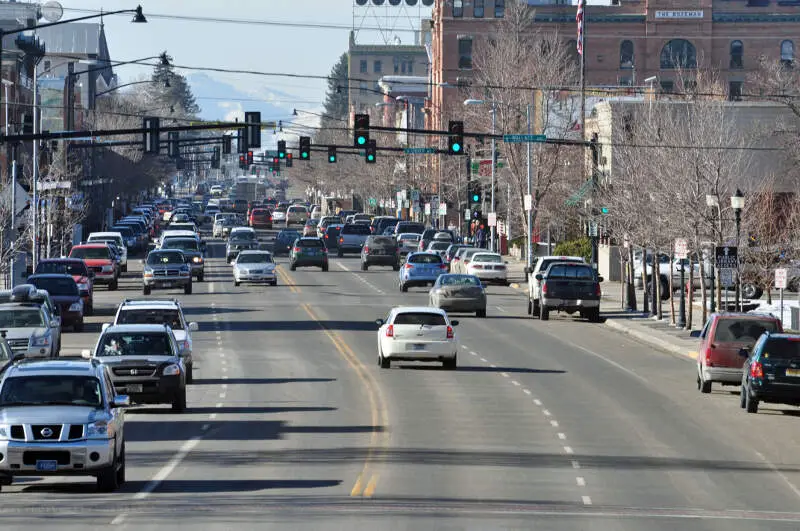
More on Bozeman: Crime Report | Homes For Sale | Data
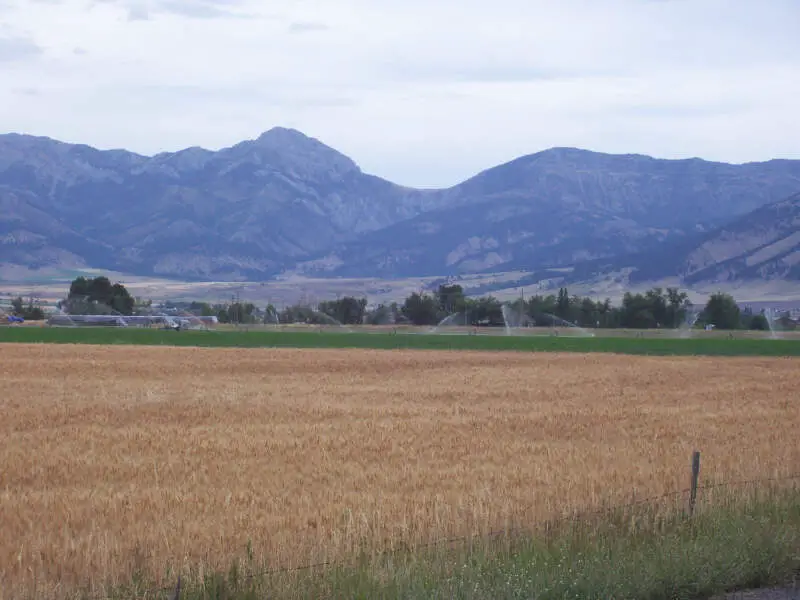
/10
Rank Last Year: 5 (No Change)
Population: 32,655
Population 2010: 27,672
Growth: 18.0%
More on Helena: Crime Report | Homes For Sale | Data
/10
Rank Last Year: 6 (No Change)
Population: 23,935
Population 2010: 19,298
Growth: 24.0%
More on Kalispell: Crime Report | Homes For Sale | Data
/10
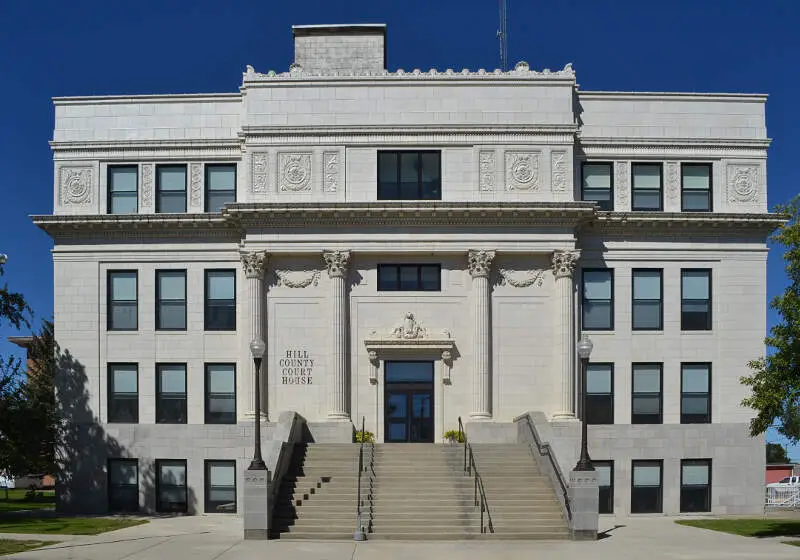
Rank Last Year: 7 (No Change)
Population: 9,739
Population 2010: 9,261
Growth: 5.2%
More on Havre: Crime Report | Homes For Sale | Data
/10
Rank Last Year: 11 (Up 3)
Population: 9,184
Population 2010: 7,281
Growth: 26.1%
More on Belgrade: Crime Report | Homes For Sale | Data
/10
Rank Last Year: 8 (Down 1)
Population: 9,153
Population 2010: 9,270
Growth: -1.3%
More on Anaconda-Deer Lodge County: Homes For Sale | Data
/10
Rank Last Year: 13 (Up 3)
Population: 8,546
Population 2010: 7,923
Growth: 7.9%
More on Helena Valley Southeast: Homes For Sale | Data
How We Determined The Largest Cities In Montana
We've been ranking and dissecting cities in the Treasure State for over 4 years now -- making this actually the fourth time we've run the numbers. We always use the best data, the US Census. In this case, that means we are using the 2013-2017 American Community Survey.
It what is probably the most simple analysis we run each year, we ranked every place in Montana from biggest to smallest. The biggest city this year? That would be Billings.
The smallest? Whitehall, although there are places smaller than 1,000 people not listed here, so keep that in mind as we take a look at the top ten.
Now on to numbers 11-100 Biggest in Montana
We hope that you find the big city, or really any city, that's right for you. Below is a list of the rest of the biggest cities along with every other place in Montana.
Have fun snacking around in the Treasure State!
For more reading on Montana, check out:
- Best Places To Raise A Family In Montana
- Best Places To Retire In Montana
- Richest Cities In Montana
- Safest Places In Montana
- Worst Places To Live In Montana
- Most Expensive Places To Live In Montana
Detailed List Of The Biggest Cities In Montana
| Rank | City | Current Population | 2010 | Growth | |||||
|---|---|---|---|---|---|---|---|---|---|
| 1 | Billings | 109,705 | 101,549 | 8.0% | |||||
| 2 | Missoula | 74,994 | 65,383 | 14.7% | |||||
| 3 | Great Falls | 58,717 | 57,873 | 1.5% | |||||
| 4 | Bozeman | 48,330 | 36,440 | 32.6% | |||||
| 5 | Helena | 32,655 | 27,672 | 18.0% | |||||
| 6 | Kalispell | 23,935 | 19,298 | 24.0% | |||||
| 7 | Havre | 9,739 | 9,261 | 5.2% | |||||
| 8 | Belgrade | 9,184 | 7,281 | 26.1% | |||||
| 9 | Anaconda-Deer Lodge County | 9,153 | 9,270 | -1.3% | |||||
| 10 | Helena Valley Southeast | 8,546 | 7,923 | 7.9% | |||||
| 11 | Evergreen | 8,416 | 7,446 | 13.0% | |||||
| 12 | Miles City | 8,372 | 8,308 | 0.8% | |||||
| 13 | Lockwood | 8,206 | 6,580 | 24.7% | |||||
| 14 | Helena Valley West Central | 8,042 | 8,197 | -1.9% | |||||
| 15 | Whitefish | 8,032 | 6,352 | 26.4% | |||||
| 16 | Livingston | 7,696 | 7,094 | 8.5% | |||||
| 17 | Laurel | 6,797 | 6,620 | 2.7% | |||||
| 18 | Sidney | 6,351 | 5,052 | 25.7% | |||||
| 19 | Lewistown | 5,923 | 5,954 | -0.5% | |||||
| 20 | Columbia Falls | 5,651 | 4,626 | 22.2% | |||||
| 21 | Orchard Homes | 5,480 | 6,259 | -12.4% | |||||
| 22 | Polson | 5,033 | 4,468 | 12.6% | |||||
| 23 | Glendive | 5,030 | 4,899 | 2.7% | |||||
| 24 | Four Corners | 4,859 | 2,837 | 71.3% | |||||
| 25 | Hamilton | 4,827 | 4,326 | 11.6% | |||||
| 26 | Bigfork | 4,733 | 4,401 | 7.5% | |||||
| 27 | Dillon | 4,333 | 4,109 | 5.5% | |||||
| 28 | Helena Valley Northwest | 4,256 | 3,266 | 30.3% | |||||
| 29 | Lolo | 4,064 | 3,081 | 31.9% | |||||
| 30 | Malmstrom Afb | 3,902 | 4,820 | -19.0% | |||||
| 31 | Hardin | 3,777 | 3,450 | 9.5% | |||||
| 32 | Helena Valley Northeast | 3,519 | 2,649 | 32.8% | |||||
| 33 | Glasgow | 3,332 | 3,211 | 3.8% | |||||
| 34 | Big Sky | 3,054 | 1,528 | 99.9% | |||||
| 35 | Cut Bank | 3,049 | 2,884 | 5.7% | |||||
| 36 | Deer Lodge | 2,893 | 3,145 | -8.0% | |||||
| 37 | Shelby | 2,875 | 3,277 | -12.3% | |||||
| 38 | North Browning | 2,862 | 2,686 | 6.6% | |||||
| 39 | Montana City | 2,821 | 2,505 | 12.6% | |||||
| 40 | Libby | 2,758 | 2,681 | 2.9% | |||||
| 41 | Wolf Point | 2,739 | 2,585 | 6.0% | |||||
| 42 | Conrad | 2,624 | 2,582 | 1.6% | |||||
| 43 | Colstrip | 2,335 | 2,274 | 2.7% | |||||
| 44 | Lame Deer | 2,288 | 2,115 | 8.2% | |||||
| 45 | Lakeside | 2,245 | 1,608 | 39.6% | |||||
| 46 | East Missoula | 2,214 | 1,830 | 21.0% | |||||
| 47 | Red Lodge | 2,134 | 2,297 | -7.1% | |||||
| 48 | Townsend | 2,080 | 2,135 | -2.6% | |||||
| 49 | Malta | 2,058 | 2,051 | 0.3% | |||||
| 50 | Pablo | 2,032 | 2,023 | 0.4% | |||||
| 51 | Three Forks | 1,977 | 1,503 | 31.5% | |||||
| 52 | Crow Agency | 1,972 | 923 | 113.7% | |||||
| 53 | Columbus | 1,964 | 2,324 | -15.5% | |||||
| 54 | Clancy | 1,964 | 1,847 | 6.3% | |||||
| 55 | Manhattan | 1,950 | 1,396 | 39.7% | |||||
| 56 | King Arthur Park | 1,933 | 563 | 243.3% | |||||
| 57 | Baker | 1,905 | 1,851 | 2.9% | |||||
| 58 | Stevensville | 1,897 | 2,199 | -13.7% | |||||
| 59 | Choteau | 1,878 | 1,718 | 9.3% | |||||
| 60 | Ronan | 1,812 | 2,048 | -11.5% | |||||
| 61 | Corvallis | 1,755 | 616 | 184.9% | |||||
| 62 | South Browning | 1,742 | 1,838 | -5.2% | |||||
| 63 | Frenchtown | 1,741 | 1,162 | 49.8% | |||||
| 64 | Big Timber | 1,736 | 1,781 | -2.5% | |||||
| 65 | Roundup | 1,723 | 1,790 | -3.7% | |||||
| 66 | East Helena | 1,684 | 1,806 | -6.8% | |||||
| 67 | Helena West Side | 1,656 | 1,411 | 17.4% | |||||
| 68 | West Glendive | 1,635 | 1,996 | -18.1% | |||||
| 69 | Sun Prairie | 1,617 | 1,764 | -8.3% | |||||
| 70 | Forsyth | 1,596 | 1,799 | -11.3% | |||||
| 71 | Plentywood | 1,527 | 1,855 | -17.7% | |||||
| 72 | Fort Belknap Agency | 1,520 | 1,455 | 4.5% | |||||
| 73 | Eureka | 1,517 | 1,196 | 26.8% | |||||
| 74 | Seeley Lake | 1,512 | 1,374 | 10.0% | |||||
| 75 | Thompson Falls | 1,489 | 1,481 | 0.5% | |||||
| 76 | Fort Benton | 1,410 | 1,478 | -4.6% | |||||
| 77 | Bonner-West Riverside | 1,404 | 1,644 | -14.6% | |||||
| 78 | Chinook | 1,225 | 1,418 | -13.6% | |||||
| 79 | Helena Flats | 1,219 | 1,002 | 21.7% | |||||
| 80 | West Yellowstone | 1,090 | 1,100 | -0.9% | |||||
| 81 | Park City | 1,090 | 1,023 | 6.5% | |||||
| 82 | Somers | 1,079 | 969 | 11.4% | |||||
| 83 | Chester | 1,076 | 765 | 40.7% | |||||
| 84 | Absarokee | 1,048 | 1,001 | 4.7% | |||||
| 85 | Scobey | 1,047 | 789 | 32.7% | |||||
| 86 | Marion | 1,041 | 478 | 117.8% | |||||
| 87 | Harlowton | 1,031 | 888 | 16.1% | |||||
| 88 | Boulder | 1,027 | 1,484 | -30.8% | |||||
| 89 | Plains | 1,019 | 1,031 | -1.2% | |||||
| 90 | Lincoln | 1,017 | 881 | 15.4% | |||||
| 91 | Whitehall | 1,000 | 1,175 | -14.9% | |||||